W-01: Mapping Ecosystem Services for Decision Making

Introduction
Welcome to this hands-on workshop notebook for W-01: Mapping Ecosystem Services for Decision Making. This notebook is designed to guide participants through a practical workflow for mapping cultural ecosystem service (CES) flows from geotagged social media imagery using vision-language models, geospatial analysis, and interactive visualization.
Cultural ecosystem services are the non-material benefits that people obtain from nature, such as outdoor recreation, wildlife viewing, and landscape appreciation. These services are important for conservation planning, landscape management, and decision making, but they are often difficult to measure because they depend on human experiences, behaviors, and perceptions.
In this workshop, we use a Florida case study to demonstrate how geotagged Flickr images and CLIP-based models can support scalable and label-efficient mapping of cultural ecosystem services. Participants will work through an end-to-end workflow that includes Flickr data preparation, spatial filtering, CES classification, flow quantification using photo-user-days, and visualization of results across natural and working landscapes. This workflow builds on our recent research showing that a hybrid CLIP-BRF-ZS pipeline can classify 12 CES classes under open-set conditions with strong performance while using only a small labeled development set.
This notebook is organized for a workshop setting and emphasizes learning by doing. Rather than focusing only on model theory, it is designed to help participants understand how these tools can be used in practice to identify CES hotspots, compare landscape contributions, and create map products that support planning, conservation, and ecosystem-service assessment.
Resources
- GitHub: https://github.com/Ecosystem-Services-GeoAI/FL-CES-Flows-CLIP
- Paper: Mapping Cultural Ecosystem Service Flows from Social Media Imagery with Vision–Language Models: A Zero-Shot CLIP Framework
- Platform: Florida Cultural Ecosystem Services (CES) Flow Explorer.
References
Liao, H. Y., Zhao, C., Song, J., & Shao, W. (2025, November). Mapping Cultural Ecosystem Services Using One-Shot In-Context Learning with Multimodal Large Language Models. In Proceedings of the 33rd ACM International Conference on Advances in Geographic Information Systems (pp. 1071–1074). https://doi.org/10.1145/3748636.3764178
Liao, H.-Y., Zhao, C., Koylu, C., Cao, H., Qiu, J., Callaghan, C. T., Song, J., & Shao, W. (2025). Mapping Cultural Ecosystem Service Flows from Social Media Imagery with Vision–Language Models: A Zero-Shot CLIP Framework. EcoEvoRxiv. https://doi.org/10.32942/X29S8C
The workflow leverages Flickr imagery (2014–2019) across the state of Florida's natural and working lands to support scalable, interpretable, and reproducible CES analysis.
Learning Objectives
By the end of this workshop, participants will be able to:
- understand the basic concept of cultural ecosystem service flows
- explain how geotagged social media imagery can be used as a proxy for human–nature interactions
- understand the role of CLIP and hybrid CLIP-based pipelines in low-label CES classification
- prepare Flickr image metadata and supporting spatial datasets for analysis
- apply spatial filtering to retain images within relevant natural and working landscapes
- summarize CES flows using photo-user-days
- visualize and interpret CES patterns across greenspace and land-cover types
- discuss how these outputs can support ecosystem-service mapping for decision making
Workshop Notes
- This notebook is designed for a hands-on workshop setting.
- Participants are encouraged to run each section step by step.
- Some cells may take longer to run depending on data size and Colab resources.
- If you are new to Colab, do not worry — the notebook is structured to provide both context and code together.
- Questions and exploration are encouraged throughout the workshop.
Notebook Structure
This notebook is organized into the following sections:
1. Workshop Overview
A short introduction to the workshop goals, study context, and expected outcomes.
2. Why CES Mapping Matters
A brief overview of cultural ecosystem services, CES flows, and why they matter for landscape planning and management.
3. Workflow Overview
A roadmap of the analytical workflow used in this notebook, from data collection to mapping and interpretation.
4. Environment Setup
Install required packages, set up Google Colab, and prepare the runtime environment.
5. Data Preparation
Load Flickr metadata, images, and supporting spatial layers needed for the analysis.
6. CLIP-Based CES Classification
Run the CES image-classification workflow using CLIP-based methods.
7. CES Flow Quantification
Summarize classified CES flows using photo-user-days and related metrics.
8. Visualization and Interpretation
Create tables, figures, and maps to examine CES patterns across landscapes.
9. Spatial Filtering and Landscape Context
Assign images to land-use/land-cover classes.
10. Discussion for Decision Making
Interpret the outputs and discuss how CES maps can inform planning, conservation, and management.
11. Wrap-Up
Summarize key takeaways and provide links to resources, code, and related outputs.
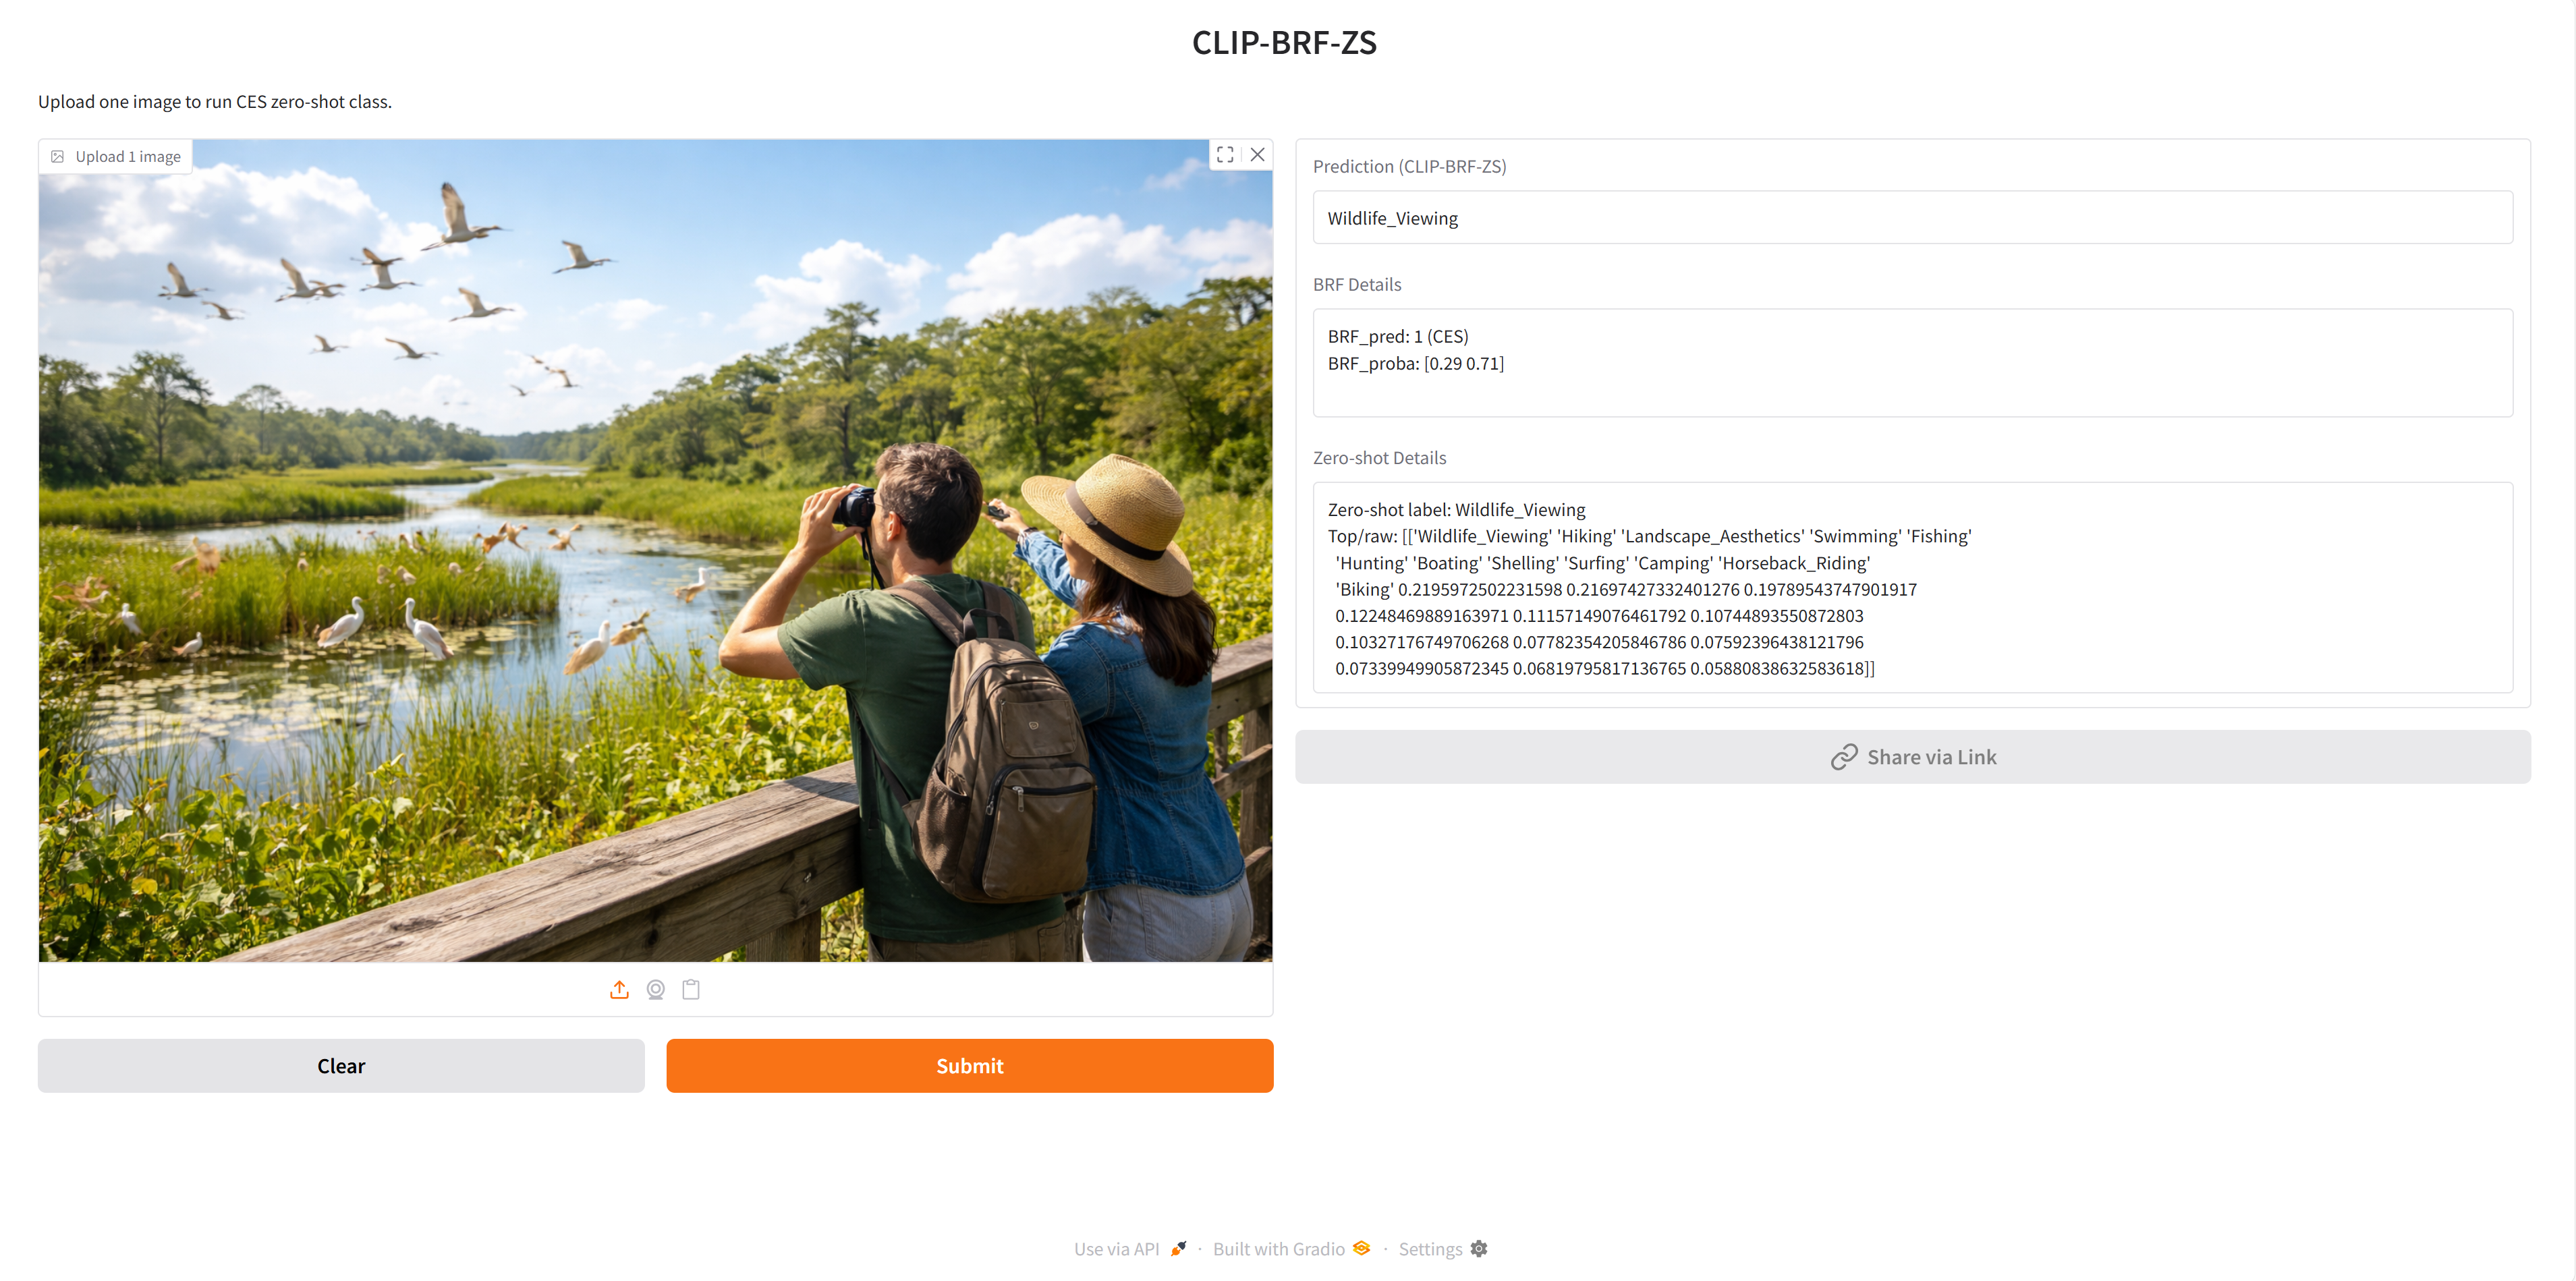
Hugging Face Application
🤗 Hugging Face Application: https://huggingface.co/spaces/haoyuliao/FL-CES-Flows-CLIP
Environmental Setup
!pip -q install huggingface_hub pandas pillow matplotlib
!pip -q install gdown
!pip -q install rasterio
!pip -q install geopandas folium
import os
import zipfile
import pandas as pd
import matplotlib.pyplot as plt
from PIL import Image
from huggingface_hub import hf_hub_download
Load Flickr30k
repo_id = "nlphuji/flickr30k"
csv_path = hf_hub_download(
repo_id=repo_id,
filename="flickr_annotations_30k.csv",
repo_type="dataset"
)
zip_path = hf_hub_download(
repo_id=repo_id,
filename="flickr30k-images.zip",
repo_type="dataset"
)
print("CSV downloaded to:", csv_path)
print("ZIP downloaded to:", zip_path)
/usr/local/lib/python3.12/dist-packages/huggingface_hub/utils/_auth.py:93: UserWarning: The secret `HF_TOKEN` does not exist in your Colab secrets. To authenticate with the Hugging Face Hub, create a token in your settings tab (https://huggingface.co/settings/tokens), set it as secret in your Google Colab and restart your session. You will be able to reuse this secret in all of your notebooks. Please note that authentication is recommended but still optional to access public models or datasets. warnings.warn(
CSV downloaded to: /root/.cache/huggingface/hub/datasets--nlphuji--flickr30k/snapshots/2b239befc81b6e3f035ce6bd52f5f4d60f5625f7/flickr_annotations_30k.csv ZIP downloaded to: /root/.cache/huggingface/hub/datasets--nlphuji--flickr30k/snapshots/2b239befc81b6e3f035ce6bd52f5f4d60f5625f7/flickr30k-images.zip
Extract images
extract_dir = "/content/flickr30k_images"
if not os.path.exists(extract_dir):
os.makedirs(extract_dir, exist_ok=True)
with zipfile.ZipFile(zip_path, "r") as zf:
zf.extractall(extract_dir)
print("Images extracted to:", extract_dir)
Images extracted to: /content/flickr30k_images
df = pd.read_csv(csv_path)
print("Data shape:", df.shape)
print(df.head())
print(df.columns)
Data shape: (31014, 5)
raw sentids \
0 ["Two young guys with shaggy hair look at thei... [0, 1, 2, 3, 4]
1 ["Several men in hard hats are operating a gia... [5, 6, 7, 8, 9]
2 ["A child in a pink dress is climbing up a set... [10, 11, 12, 13, 14]
3 ["Someone in a blue shirt and hat is standing ... [15, 16, 17, 18, 19]
4 ["Two men, one in a gray shirt, one in a black... [20, 21, 22, 23, 24]
split filename img_id
0 train 1000092795.jpg 0
1 train 10002456.jpg 1
2 train 1000268201.jpg 2
3 train 1000344755.jpg 3
4 train 1000366164.jpg 4
Index(['raw', 'sentids', 'split', 'filename', 'img_id'], dtype='object')
# The repo filenames are usually like "1000092795.jpg"
filename_col = "filename" # adjust if needed after inspection
img_name = df.iloc[0][filename_col] ##Change number to check photo
# Sometimes extraction creates nested folder: /content/flickr30k_images/flickr30k-images/
candidate_paths = [
os.path.join(extract_dir, img_name),
os.path.join(extract_dir, "flickr30k-images", img_name),
]
img_path = None
for p in candidate_paths:
if os.path.exists(p):
img_path = p
break
if img_path is None:
raise FileNotFoundError(f"Could not find image: {img_name}")
img = Image.open(img_path)
plt.figure(figsize=(8, 6))
plt.imshow(img)
plt.axis("off")
plt.title(img_name)
plt.show()

CES CLIP
CLIP Model
This workshop uses CLIP (Contrastive Language–Image Pretraining) as the core vision-language model for cultural ecosystem service (CES) image classification. CLIP is designed to learn a shared embedding space for images and text, allowing visual content and natural-language descriptions to be compared directly. Instead of training a separate image classifier from scratch for each task, CLIP can perform zero-shot classification by measuring the similarity between an input image and a set of text prompts that describe possible classes.
In practice, CLIP includes two main components: an image encoder and a text encoder. The image encoder transforms an image into a numeric feature vector, while the text encoder converts each prompt into a corresponding text feature vector. These vectors are projected into the same semantic space, where similarity can be measured using cosine similarity. For a given image, the model compares its embedding with the embeddings of candidate text prompts and assigns the label associated with the most similar prompt.
This design is especially useful for CES mapping because CES categories such as biking, wildlife viewing, and landscape aesthetics can be expressed as natural-language prompts rather than requiring large task-specific training datasets. In this workshop, CLIP is used as a flexible and label-efficient foundation model for identifying CES-related content from geotagged Flickr images. The workflow builds on our recent study, which used MobileCLIP-S1 as the main CLIP variant and showed that CLIP-based approaches can provide strong CES classification performance under both closed-set and open-set conditions.
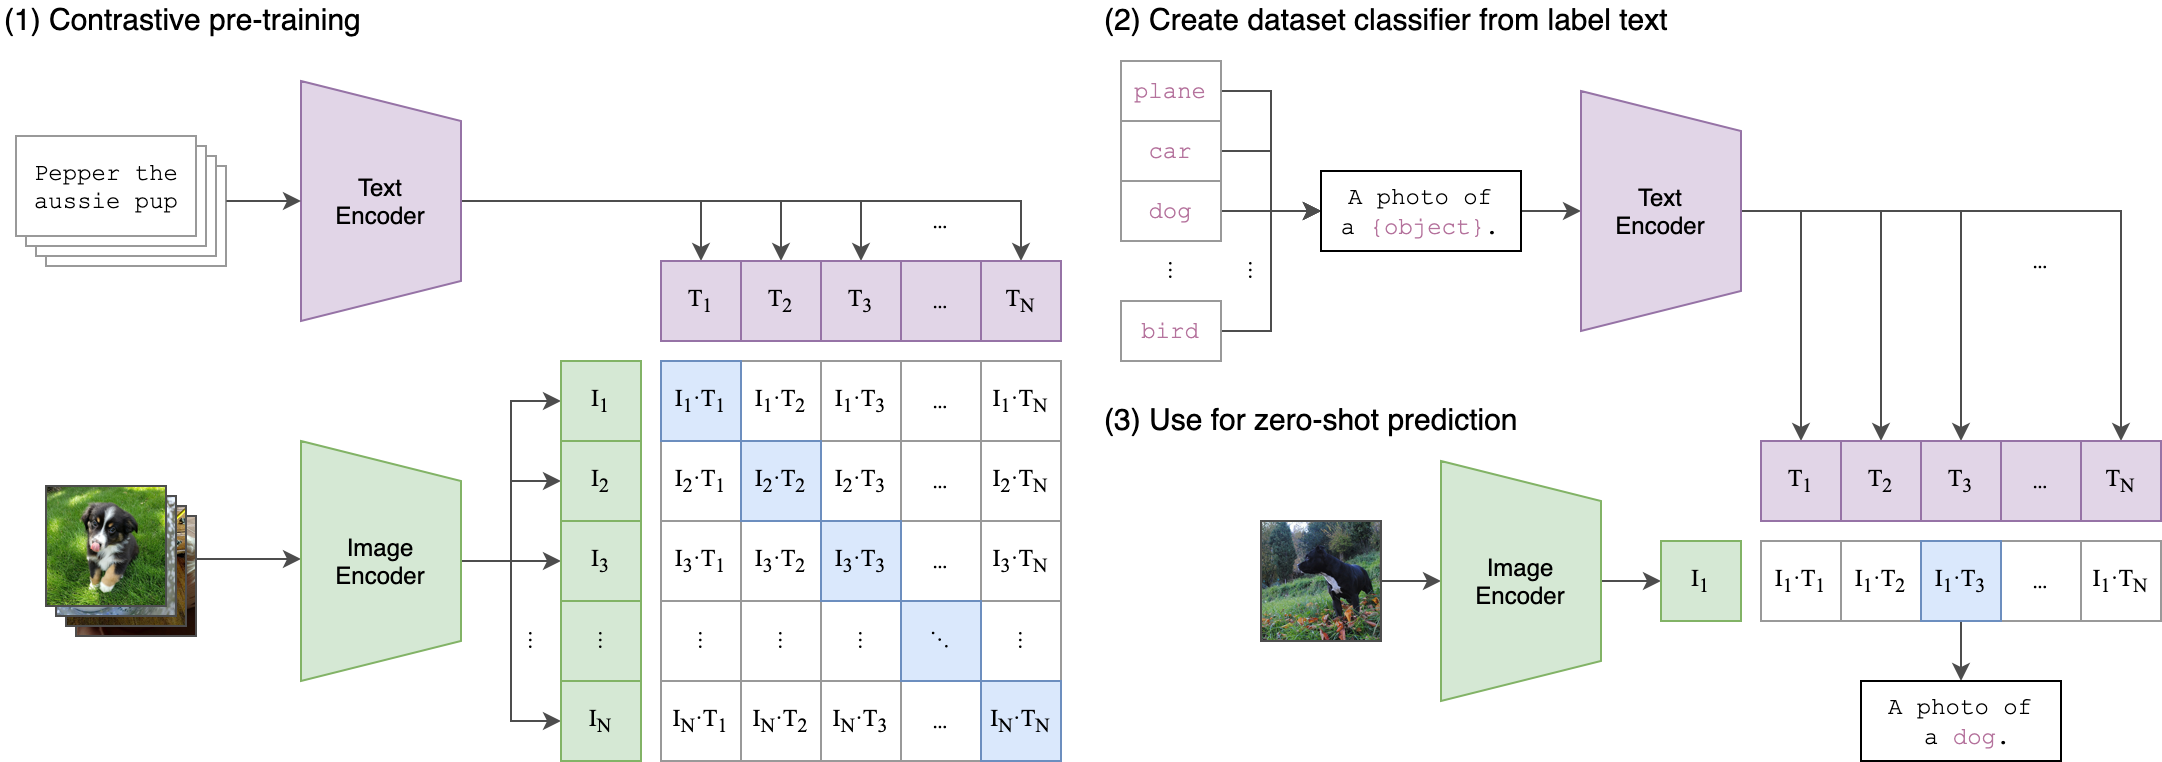 Image credit from: https://github.com/openai/CLIP
Why CLIP is useful in the CES mapping
- It supports zero-shot learning, so categories can be defined through text prompts.
- It reduces the need for large manually labeled image datasets.
- It provides a practical way to connect social media imagery with interpretable CES categories.
- It can be combined with lightweight supervised models to improve robustness under open-set conditions.
In this notebook, CLIP is used as a practical tool for mapping CES flows from Flickr images and for demonstrating how vision-language models can support ecosystem service assessment and decision making. We will learn how to apply the CLIP-BRF-ZS tool to quantify the CES flows.
Normalized confusion matrices for the three CLIP modeling pipelines (a) CLIP-ZS-TF, (b) CLIP-BRF-ZS, and (c) CLIP-MRF on the testing set under open-set conditions:
Comparative performance of three CLIP-based modeling pipelines on the testing set under open-set conditions:
CLIP Environmental Setup
# =========================
# 1) Upgrade pip
# =========================
!pip -q install --upgrade pip
# =========================
# 2) Install core packages
# =========================
!pip -q install \
numpy \
pandas \
scipy \
scikit-learn \
joblib \
matplotlib \
seaborn \
openpyxl \
geopandas \
shapely \
pyogrio \
tqdm==4.67.1 \
ftfy==6.3.1 \
regex==2025.11.3 \
timm==1.0.22 \
open-clip-torch==2.29.0
# 1) Download the module file
!wget -O CLIP_Module.py "https://raw.githubusercontent.com/Ecosystem-Services-GeoAI/FL-CES-Flows-CLIP/refs/heads/main/notebooks/CLIP-BRF-ZS/CLIP_Module.py"
"""
## Helper Module: `CLIP_Module.py`
This helper module provides a set of functions used to support the **CLIP-BRF-ZS** workflow. It includes
functions for standardizing CES class names, calculating classification metrics, generating and saving
confusion matrices, loading and preprocessing images, and running CLIP-based inference on batches of
images. In practice, the module helps organize repeated tasks such as image preparation, model prediction,
and evaluation into reusable functions, making the notebook cleaner and easier to follow. The code includes
helpers such as `nameCover()` for label standardization, `classification_metrics()` for summary
statistics, `plotCom()` for confusion-matrix visualization, `storeImgs()` for image loading and
preprocessing, and `CLIP()` for batch zero-shot inference using the CLIP model.
"""
# 2) Import it
import CLIP_Module
# 3) Check available functions
print(dir(CLIP_Module))
--2026-04-22 16:18:00-- https://raw.githubusercontent.com/Ecosystem-Services-GeoAI/FL-CES-Flows-CLIP/refs/heads/main/notebooks/CLIP-BRF-ZS/CLIP_Module.py Resolving raw.githubusercontent.com (raw.githubusercontent.com)... 185.199.111.133, 185.199.108.133, 185.199.109.133, ... Connecting to raw.githubusercontent.com (raw.githubusercontent.com)|185.199.111.133|:443... connected. HTTP request sent, awaiting response... 200 OK Length: 20058 (20K) [text/plain] Saving to: ‘CLIP_Module.py’ CLIP_Module.py 100%[===================>] 19.59K --.-KB/s in 0.005s 2026-04-22 16:18:00 (3.66 MB/s) - ‘CLIP_Module.py’ saved [20058/20058] ['CLIP', 'CLIP_MultPrompt', 'ConfusionMatrixDisplay', 'GetPred', 'Image', '__builtins__', '__cached__', '__doc__', '__file__', '__loader__', '__name__', '__package__', '__spec__', 'accuracy_score', 'classification_metrics', 'confusion_matrix', 'device', 'f1_score', 'hash2pandas', 'nameCover', 'np', 'os', 'pd', 'plotCom', 'plt', 'precision_score', 'recall_score', 'saveImg', 'storeImgs', 'storeImgsAllFL', 'time', 'torch']
import numpy as np
import torch
import warnings
import shutil
import joblib
import open_clip
from open_clip import tokenizer
import time
import os, glob
import IPython.display
import matplotlib.pyplot as plt
from PIL import Image
import numpy as np
import pandas as pd
import random
from collections import OrderedDict
import torch
import importlib
from sklearn.ensemble import RandomForestClassifier
from sklearn.metrics import classification_report, confusion_matrix
import joblib
%matplotlib inline
%config InlineBackend.figure_format = 'retina'
# Ignore all warnings5
warnings.filterwarnings("ignore")
Load Module
import CLIP_Module
importlib.reload(CLIP_Module)
from CLIP_Module import * # Re-import function to reflect updates
Load Images
# set your Flickr30k image folder
flickr30k_img_dir = "/content/flickr30k_images/flickr30k-images"
Florida_Images_Folders = (
glob.glob(os.path.join(flickr30k_img_dir, "*.jpg")) +
glob.glob(os.path.join(flickr30k_img_dir, "*.png"))
)
images_paths_map = {
os.path.basename(x).split(".")[0]: x
for x in Florida_Images_Folders
}
photo_ids = [
os.path.basename(x).split(".")[0]
for x in Florida_Images_Folders
]
random.seed(119)
photo_ids = random.sample(photo_ids, 5)
print("Number of images:", len(Florida_Images_Folders))
print("Example photo id:", photo_ids[:5])
Number of images: 31783 Example photo id: ['67491882', '2366020313', '4986921677', '2563043367', '6939568656']
import matplotlib.pyplot as plt
from PIL import Image
# show selected 5 images
fig, axes = plt.subplots(1, len(photo_ids), figsize=(20, 5))
if len(photo_ids) == 1:
axes = [axes]
for ax, pid in zip(axes, photo_ids):
img_path = images_paths_map[pid]
img = Image.open(img_path)
ax.imshow(img)
ax.set_title(pid, fontsize=10)
ax.axis("off")
plt.tight_layout()
plt.show()

Load the trained Binary Random Forest (BRF) model
Binary Random Forest (BRF) Model
In this workflow, the Binary Random Forest (BRF) model is used as a first-level filtering step to distinguish CES-relevant images from irrelevant or out-of-scope images. Random Forest is an ensemble learning method that fits multiple decision trees on bootstrap samples and combines their predictions to improve robustness and generalization. Here, we use the scikit-learn implementation of RandomForestClassifier to train the BRF on CLIP-derived image embeddings.
After training, the fitted BRF model is saved and later loaded as a pretrained model object using joblib.load(), which is a common way to serialize and reuse scikit-learn models in Python. This allows the workshop workflow to apply the trained BRF directly without retraining it each time. See the official documentation for scikit-learn RandomForestClassifier.

Image logo from: https://scikit-learn.org/
!wget -O BRF_model.joblib "https://raw.githubusercontent.com/Ecosystem-Services-GeoAI/FL-CES-Flows-CLIP/main/model/BRF_model.joblib"
--2026-04-22 16:18:48-- https://raw.githubusercontent.com/Ecosystem-Services-GeoAI/FL-CES-Flows-CLIP/main/model/BRF_model.joblib Resolving raw.githubusercontent.com (raw.githubusercontent.com)... 185.199.108.133, 185.199.109.133, 185.199.110.133, ... Connecting to raw.githubusercontent.com (raw.githubusercontent.com)|185.199.108.133|:443... connected. HTTP request sent, awaiting response... 200 OK Length: 517449 (505K) [application/octet-stream] Saving to: ‘BRF_model.joblib’ BRF_model.joblib 100%[===================>] 505.32K --.-KB/s in 0.1s 2026-04-22 16:18:49 (4.01 MB/s) - ‘BRF_model.joblib’ saved [517449/517449]
clf = joblib.load("BRF_model.joblib")
Load CLIP model
# Load CLIP Model
model_name = 'MobileCLIP-S1' # Replace with your model
pretrained = 'datacompdr' # Specify the pretrained source
model, _, preprocess = open_clip.create_model_and_transforms(model_name, pretrained=pretrained)
tokenizer = open_clip.get_tokenizer(model_name) # Correct tokenizer initialization
# Set device
device = "cuda" if torch.cuda.is_available() else "cpu"
model.to(device)
model.eval(); #Important to turn on.
Available CLIP Models
The current open_clip environment provides 163 available model–checkpoint combinations that can be used for inference. Each option is defined by a pair of values: model_name and pretrained. The model_name specifies the CLIP architecture or backbone, while pretrained specifies which pretrained checkpoint is loaded for that architecture. Together, these two settings determine which vision-language model is used in the workflow. The detailed pretrain list
You can change the parameters below to load a different CLIP model.
model_name = " "
pretrained = " "
from IPython.display import HTML
pairs = open_clip.list_pretrained()
df_models = pd.DataFrame(pairs, columns=["model_name", "pretrained"])
html = df_models.to_html()
HTML(f"""
<h2>Available CLIP Models</h2>
<div style="max-height:600px; overflow:auto; border:1px solid #ccc;">
{html}
</div>
""")
Available CLIP Models
| model_name | pretrained | |
|---|---|---|
| 0 | RN50 | openai |
| 1 | RN50 | yfcc15m |
| 2 | RN50 | cc12m |
| 3 | RN101 | openai |
| 4 | RN101 | yfcc15m |
| 5 | RN50x4 | openai |
| 6 | RN50x16 | openai |
| 7 | RN50x64 | openai |
| 8 | ViT-B-32 | openai |
| 9 | ViT-B-32 | laion400m_e31 |
| 10 | ViT-B-32 | laion400m_e32 |
| 11 | ViT-B-32 | laion2b_e16 |
| 12 | ViT-B-32 | laion2b_s34b_b79k |
| 13 | ViT-B-32 | datacomp_xl_s13b_b90k |
| 14 | ViT-B-32 | datacomp_m_s128m_b4k |
| 15 | ViT-B-32 | commonpool_m_clip_s128m_b4k |
| 16 | ViT-B-32 | commonpool_m_laion_s128m_b4k |
| 17 | ViT-B-32 | commonpool_m_image_s128m_b4k |
| 18 | ViT-B-32 | commonpool_m_text_s128m_b4k |
| 19 | ViT-B-32 | commonpool_m_basic_s128m_b4k |
| 20 | ViT-B-32 | commonpool_m_s128m_b4k |
| 21 | ViT-B-32 | datacomp_s_s13m_b4k |
| 22 | ViT-B-32 | commonpool_s_clip_s13m_b4k |
| 23 | ViT-B-32 | commonpool_s_laion_s13m_b4k |
| 24 | ViT-B-32 | commonpool_s_image_s13m_b4k |
| 25 | ViT-B-32 | commonpool_s_text_s13m_b4k |
| 26 | ViT-B-32 | commonpool_s_basic_s13m_b4k |
| 27 | ViT-B-32 | commonpool_s_s13m_b4k |
| 28 | ViT-B-32 | metaclip_400m |
| 29 | ViT-B-32 | metaclip_fullcc |
| 30 | ViT-B-32-256 | datacomp_s34b_b86k |
| 31 | ViT-B-16 | openai |
| 32 | ViT-B-16 | laion400m_e31 |
| 33 | ViT-B-16 | laion400m_e32 |
| 34 | ViT-B-16 | laion2b_s34b_b88k |
| 35 | ViT-B-16 | datacomp_xl_s13b_b90k |
| 36 | ViT-B-16 | datacomp_l_s1b_b8k |
| 37 | ViT-B-16 | commonpool_l_clip_s1b_b8k |
| 38 | ViT-B-16 | commonpool_l_laion_s1b_b8k |
| 39 | ViT-B-16 | commonpool_l_image_s1b_b8k |
| 40 | ViT-B-16 | commonpool_l_text_s1b_b8k |
| 41 | ViT-B-16 | commonpool_l_basic_s1b_b8k |
| 42 | ViT-B-16 | commonpool_l_s1b_b8k |
| 43 | ViT-B-16 | dfn2b |
| 44 | ViT-B-16 | metaclip_400m |
| 45 | ViT-B-16 | metaclip_fullcc |
| 46 | ViT-B-16-plus-240 | laion400m_e31 |
| 47 | ViT-B-16-plus-240 | laion400m_e32 |
| 48 | ViT-L-14 | openai |
| 49 | ViT-L-14 | laion400m_e31 |
| 50 | ViT-L-14 | laion400m_e32 |
| 51 | ViT-L-14 | laion2b_s32b_b82k |
| 52 | ViT-L-14 | datacomp_xl_s13b_b90k |
| 53 | ViT-L-14 | commonpool_xl_clip_s13b_b90k |
| 54 | ViT-L-14 | commonpool_xl_laion_s13b_b90k |
| 55 | ViT-L-14 | commonpool_xl_s13b_b90k |
| 56 | ViT-L-14 | metaclip_400m |
| 57 | ViT-L-14 | metaclip_fullcc |
| 58 | ViT-L-14 | dfn2b |
| 59 | ViT-L-14-336 | openai |
| 60 | ViT-H-14 | laion2b_s32b_b79k |
| 61 | ViT-H-14 | metaclip_fullcc |
| 62 | ViT-H-14 | dfn5b |
| 63 | ViT-H-14-378 | dfn5b |
| 64 | ViT-g-14 | laion2b_s12b_b42k |
| 65 | ViT-g-14 | laion2b_s34b_b88k |
| 66 | ViT-bigG-14 | laion2b_s39b_b160k |
| 67 | ViT-bigG-14 | metaclip_fullcc |
| 68 | roberta-ViT-B-32 | laion2b_s12b_b32k |
| 69 | xlm-roberta-base-ViT-B-32 | laion5b_s13b_b90k |
| 70 | xlm-roberta-large-ViT-H-14 | frozen_laion5b_s13b_b90k |
| 71 | convnext_base | laion400m_s13b_b51k |
| 72 | convnext_base_w | laion2b_s13b_b82k |
| 73 | convnext_base_w | laion2b_s13b_b82k_augreg |
| 74 | convnext_base_w | laion_aesthetic_s13b_b82k |
| 75 | convnext_base_w_320 | laion_aesthetic_s13b_b82k |
| 76 | convnext_base_w_320 | laion_aesthetic_s13b_b82k_augreg |
| 77 | convnext_large_d | laion2b_s26b_b102k_augreg |
| 78 | convnext_large_d_320 | laion2b_s29b_b131k_ft |
| 79 | convnext_large_d_320 | laion2b_s29b_b131k_ft_soup |
| 80 | convnext_xxlarge | laion2b_s34b_b82k_augreg |
| 81 | convnext_xxlarge | laion2b_s34b_b82k_augreg_rewind |
| 82 | convnext_xxlarge | laion2b_s34b_b82k_augreg_soup |
| 83 | coca_ViT-B-32 | laion2b_s13b_b90k |
| 84 | coca_ViT-B-32 | mscoco_finetuned_laion2b_s13b_b90k |
| 85 | coca_ViT-L-14 | laion2b_s13b_b90k |
| 86 | coca_ViT-L-14 | mscoco_finetuned_laion2b_s13b_b90k |
| 87 | EVA01-g-14 | laion400m_s11b_b41k |
| 88 | EVA01-g-14-plus | merged2b_s11b_b114k |
| 89 | EVA02-B-16 | merged2b_s8b_b131k |
| 90 | EVA02-L-14 | merged2b_s4b_b131k |
| 91 | EVA02-L-14-336 | merged2b_s6b_b61k |
| 92 | EVA02-E-14 | laion2b_s4b_b115k |
| 93 | EVA02-E-14-plus | laion2b_s9b_b144k |
| 94 | ViT-B-16-SigLIP | webli |
| 95 | ViT-B-16-SigLIP-256 | webli |
| 96 | ViT-B-16-SigLIP-i18n-256 | webli |
| 97 | ViT-B-16-SigLIP-384 | webli |
| 98 | ViT-B-16-SigLIP-512 | webli |
| 99 | ViT-L-16-SigLIP-256 | webli |
| 100 | ViT-L-16-SigLIP-384 | webli |
| 101 | ViT-SO400M-14-SigLIP | webli |
| 102 | ViT-SO400M-16-SigLIP-i18n-256 | webli |
| 103 | ViT-SO400M-14-SigLIP-378 | webli |
| 104 | ViT-SO400M-14-SigLIP-384 | webli |
| 105 | ViT-L-14-CLIPA | datacomp1b |
| 106 | ViT-L-14-CLIPA-336 | datacomp1b |
| 107 | ViT-H-14-CLIPA | datacomp1b |
| 108 | ViT-H-14-CLIPA-336 | laion2b |
| 109 | ViT-H-14-CLIPA-336 | datacomp1b |
| 110 | ViT-bigG-14-CLIPA | datacomp1b |
| 111 | ViT-bigG-14-CLIPA-336 | datacomp1b |
| 112 | nllb-clip-base | v1 |
| 113 | nllb-clip-large | v1 |
| 114 | nllb-clip-base-siglip | v1 |
| 115 | nllb-clip-base-siglip | mrl |
| 116 | nllb-clip-large-siglip | v1 |
| 117 | nllb-clip-large-siglip | mrl |
| 118 | MobileCLIP-S1 | datacompdr |
| 119 | MobileCLIP-S2 | datacompdr |
| 120 | MobileCLIP-B | datacompdr |
| 121 | MobileCLIP-B | datacompdr_lt |
| 122 | ViTamin-S | datacomp1b |
| 123 | ViTamin-S-LTT | datacomp1b |
| 124 | ViTamin-B | datacomp1b |
| 125 | ViTamin-B-LTT | datacomp1b |
| 126 | ViTamin-L | datacomp1b |
| 127 | ViTamin-L-256 | datacomp1b |
| 128 | ViTamin-L-336 | datacomp1b |
| 129 | ViTamin-L-384 | datacomp1b |
| 130 | ViTamin-L2 | datacomp1b |
| 131 | ViTamin-L2-256 | datacomp1b |
| 132 | ViTamin-L2-336 | datacomp1b |
| 133 | ViTamin-L2-384 | datacomp1b |
| 134 | ViTamin-XL-256 | datacomp1b |
| 135 | ViTamin-XL-336 | datacomp1b |
| 136 | ViTamin-XL-384 | datacomp1b |
| 137 | RN50-quickgelu | openai |
| 138 | RN50-quickgelu | yfcc15m |
| 139 | RN50-quickgelu | cc12m |
| 140 | RN101-quickgelu | openai |
| 141 | RN101-quickgelu | yfcc15m |
| 142 | RN50x4-quickgelu | openai |
| 143 | RN50x16-quickgelu | openai |
| 144 | RN50x64-quickgelu | openai |
| 145 | ViT-B-32-quickgelu | openai |
| 146 | ViT-B-32-quickgelu | laion400m_e31 |
| 147 | ViT-B-32-quickgelu | laion400m_e32 |
| 148 | ViT-B-32-quickgelu | metaclip_400m |
| 149 | ViT-B-32-quickgelu | metaclip_fullcc |
| 150 | ViT-B-16-quickgelu | openai |
| 151 | ViT-B-16-quickgelu | dfn2b |
| 152 | ViT-B-16-quickgelu | metaclip_400m |
| 153 | ViT-B-16-quickgelu | metaclip_fullcc |
| 154 | ViT-L-14-quickgelu | openai |
| 155 | ViT-L-14-quickgelu | metaclip_400m |
| 156 | ViT-L-14-quickgelu | metaclip_fullcc |
| 157 | ViT-L-14-quickgelu | dfn2b |
| 158 | ViT-L-14-336-quickgelu | openai |
| 159 | ViT-H-14-quickgelu | metaclip_fullcc |
| 160 | ViT-H-14-quickgelu | dfn5b |
| 161 | ViT-H-14-378-quickgelu | dfn5b |
| 162 | ViT-bigG-14-quickgelu | metaclip_fullcc |
| Pretrained tag | What it refers to | Dataset type / content | Dataset / source link |
|---|---|---|---|
openai |
OpenAI’s original CLIP checkpoint, associated with WIT / WebImageText in the OpenCLIP README. |
Large-scale web image–text pairs collected from the web; general-purpose image–caption style pretraining. |
OpenCLIP README |
yfcc15m |
A checkpoint trained on YFCC15M, derived from Flickr Creative Commons imagery. |
Social media / photo-sharing imagery from Flickr with metadata; broad real-world photography, places, events, people, nature, etc. |
YFCC100M overview |
cc12m |
A checkpoint trained on Conceptual 12M (CC12M). |
Large-scale web image–caption pairs collected for vision–language pretraining; broad visual concepts rather than a specific domain such as animals only. |
Conceptual 12M |
laion400m_* |
Checkpoints trained on LAION-400M variants. |
Large-scale web-scale image–text pairs filtered with CLIP; broad open-domain internet imagery. |
LAION-400M |
laion2b_* |
Checkpoints trained on LAION-2B variants. |
Very large-scale web image–text pairs from the LAION-5B family; broad open-domain internet imagery. |
LAION-5B / LAION-2B |
datacomp* / datacomp1b / datacompdr |
Checkpoints associated with DataComp training data or DataComp-derived recipes. |
Benchmark-oriented web image–text datasets designed to compare data selection strategies for multimodal training. |
DataComp |
metaclip_* |
Checkpoints associated with MetaCLIP training data. |
Large-scale web image–text data assembled for contrastive pretraining; broad general-purpose vision–language learning. |
MetaCLIP repository |
webli |
Checkpoints trained with WebLI data. |
Large multilingual web image–language pairs used by Google for vision–language pretraining. |
PaLI / WebLI |
dfn2b, dfn5b |
Checkpoints associated with DFN-2B and DFN-5B training data. |
Large-scale filtered web image–text datasets built with data filtering strategies for CLIP-style training. |
DFN paper |
BRF First-Level Inference
In this workflow, the Binary Random Forest (BRF) serves as the first-level inference step in the CLIP-BRF-ZS pipeline. Its role is to act as a lightweight filter that separates CES-relevant images from irrelevant or out-of-scope images before the zero-shot CLIP classification stage. Rather than asking CLIP to classify every Flickr image directly into the target CES classes, the BRF first screens the input using CLIP-derived image embeddings and predicts whether an image belongs to the targeted CES content or should be assigned to the “other” category. Images predicted as irrelevant are excluded from further CES classification, while images predicted as relevant are passed to the second stage, where CLIP assigns one of the CES class labels using text prompts.
This two-stage design helps reduce false assignments caused by noisy social media imagery and improves robustness under open-set conditions. In our Florida case study, this hybrid filtering strategy substantially improved performance compared with zero-shot threshold filtering alone and fully supervised multiclass classification under low-label conditions.
import psutil
y_pred = []
images = []
images_valid = [] #1 valid; 0: corruption
start_time = time.perf_counter()
n = 1
sub_start_time = time.perf_counter()
for idx in range(len(photo_ids)):
try:
image_path = images_paths_map[str(photo_ids[idx])]
image = Image.open(image_path).convert("RGB")
images_valid.append(1)
except:
image_path = images_paths_map[str(photo_ids[0])] #Fake Image
image = Image.open(image_path).convert("RGB")
images_valid.append(0)
images.append(preprocess(image).to(device))
if (idx+1)%500 == 0 or (idx+1) == len(photo_ids):
image_input = torch.stack(images).to(device)
with torch.no_grad():
image_features = model.encode_image(image_input).float()
image_features_cpu = np.array(image_features.cpu())
pred = clf.predict(image_features_cpu) #RF prediciton
y_pred.append(pred)
del image_input, image_features, images, image_features_cpu
torch.cuda.empty_cache() # Clear unused memory
images = []
# Get the memory usage in bytes
memory_usage = psutil.Process().memory_info().rss
# Convert to megabytes
memory_usage_mb = memory_usage / (1024 ** 2)
# End the timer
sub_end_time = time.perf_counter()
# Calculate the time taken
sub_execution_time = sub_end_time - sub_start_time
sub_start_time = time.perf_counter()
print(f"{n} Execution time: {sub_execution_time:.6f} seconds")
print(f"Memory Usage: {memory_usage_mb:.2f} MB")
n+=1
y_pred_flat = np.concatenate(y_pred) #1: CES; 0:Other
1 Execution time: 8.587920 seconds Memory Usage: 1085.72 MB
CLIP second level inference
descriptions = {
"Hiking": "This is an image of people hiking or taking a casual walk on challenging scenic trails or through breathtaking countryside.",
"Boating": "This is an image of boating with powerboats or human-powered vessels such as rowboats or paddle boats.",
"Swimming":"This is an image of people wearing swimsuits while swimming in a pool, lake, or ocean.",
"Camping":"This is camping.",
"Fishing":"This is fishing.",
"Biking":"This is biking.",
"Horseback_Riding":"This is horseback riding.",
"Wildlife_Viewing":"This is an image without people, showing wildlife such as birds, flowers, or fungi in a natural environment.",
"Shelling":"This is shelling.",
"Surfing": "This is an image of people surfing on ocean waves or holding a surfboard on the beach.",
"Hunting": "This is an image of a hunter posing with a large kill, cleaning or gutting the carcass of a feral animal.",
"Landscape_Aesthetics":"This is an image without people, showing a natural, soothing, and vibrant panoramic landscape."
}
class_names = ["Hiking", "Boating", "Swimming", "Camping", "Fishing", "Biking", "Horseback_Riding", "Wildlife_Viewing",
"Shelling", "Surfing", "Hunting","Landscape_Aesthetics"]
texts = []
for name in descriptions:
texts.append(descriptions[name])
text_tokens = tokenizer([desc for desc in texts]).to(device)
images = []
images_valid = [] #1: valid; 0: corruption
original_images = []
predicted_cover_labels_col = []
# Start the timer
start_time = time.perf_counter()
n = 1
for idx in range(len(photo_ids)):
sub_start_time = time.perf_counter()
try:
image_path = images_paths_map[str(photo_ids[idx])]
image = Image.open(image_path).convert("RGB")
images_valid.append(1)
except:
image_path = images_paths_map[str(photo_ids[0])] #Fake Image
image = Image.open(image_path).convert("RGB")
images_valid.append(0)
continue
images.append(preprocess(image).to(device))
if (idx+1)%500 == 0 or (idx+1) == len(photo_ids):
image_input = torch.stack(images).to(device)
with torch.no_grad():
image_features = model.encode_image(image_input).float()
text_features = model.encode_text(text_tokens).float()
image_features /= image_features.norm(dim=-1, keepdim=True)
text_features /= text_features.norm(dim=-1, keepdim=True)
subsimilarity = text_features.cpu().numpy() @ image_features.cpu().numpy().T
predicted_cover_labels, top = GetPred(subsimilarity, class_names)
predicted_cover_labels_col += predicted_cover_labels
if n == 1:
tops = top.copy()
else:
tops = np.vstack((tops, top.copy()))
n+=1
del image_input, image_features, text_features, subsimilarity, images, predicted_cover_labels, top
torch.cuda.empty_cache() # Clear unused memory
images = []
# End the timer
sub_end_time = time.perf_counter()
# Calculate the time taken
sub_execution_time = sub_end_time - sub_start_time
print(f"{n} Execution time: {sub_execution_time:.6f} seconds")
# End the timer
end_time = time.perf_counter()
# Calculate the time taken
execution_time = end_time - start_time
print(f"Execution time: {execution_time:.6f} seconds")
2 Execution time: 11.749081 seconds Execution time: 11.892157 seconds
Outcomes
res = {
"pid": [],
"CLIP-BRF-ZS": [],
"Image_Path": []
}
for i, pid in enumerate(photo_ids):
res["pid"].append(pid)
label = (
predicted_cover_labels_col[i]
if y_pred_flat[i] == 1
else "Other"
)
res["CLIP-BRF-ZS"].append(label)
res["Image_Path"].append(images_paths_map.get(pid, None))
df_res = pd.DataFrame(res)
df_res.to_csv("df_res.csv", index=False)
# from google.colab import files
# df_res.to_csv("/content/df_res.csv", index=False)
# files.download("/content/df_res.csv")
Example Outputs
for i in range(5):
img = Image.open(df_res.loc[i, "Image_Path"])
plt.figure(figsize=(4, 4))
plt.imshow(img)
plt.axis("off")
title = f"""
PID: {df_res.loc[i, 'pid']}
Prediction: {df_res.loc[i, 'CLIP-BRF-ZS']}
"""
plt.title(title.strip(), fontsize=10)
plt.show()


Spatial Analysis PUDs
Defining CES Flow Metrics: PUD as a Proxy
In this workshop, we use photo-user-days (PUDs) as a proxy for cultural ecosystem service (CES) flows derived from geotagged Flickr images. A PUD represents the number of unique users who took at least one photograph in a given location on a given day. This metric is commonly used in social-media-based recreation and CES studies because it reduces bias from highly active users who may upload many images during a single visit. Instead of counting raw photo numbers, PUDs provide a more stable proxy for visitation intensity and realized human–nature interactions.
In this notebook, we use two related CES flow metrics:
Average annual PUDs, denoted as $\overline{PUD}_{yr}$
This metric measures the average annual number of photo-user-days for a CES class within a 1 km grid cell. It represents the total magnitude of CES flow at a location and helps identify where overall human engagement with landscapes is highest.Average annual PUDs per user, denoted as $\overline{PUD}_{user,yr}$
This metric standardizes $\overline{PUD}_{yr}$ by the total number of unique users in the study period. It represents per-user flow intensity and allows comparison of how strongly individuals engage with CES across landscape types, independent of overall user volume.
where i denotes the 1 km grid cell, c denotes the CES class, and Nuser denotes the total number of unique users contributing geotagged images during the study period.
Together, these two metrics help us examine both the overall volume of CES flows and the intensity of engagement per user across Florida’s natural and working lands.
import pandas as pd
import geopandas as gpd
from shapely.geometry import Point
import matplotlib.pyplot as plt
import os
Data Preparation
# make folders
!mkdir -p /content/model-outputs/FL_1km_Grid
# download shapefile components
!wget -O /content/model-outputs/FL_1km_Grid/FL_1km_Grid.shp "https://raw.githubusercontent.com/Ecosystem-Services-GeoAI/FL-CES-Flows-CLIP/main/model-outputs/FL_1km_Grid/FL_1km_Grid.shp"
!wget -O /content/model-outputs/FL_1km_Grid/FL_1km_Grid.shx "https://raw.githubusercontent.com/Ecosystem-Services-GeoAI/FL-CES-Flows-CLIP/main/model-outputs/FL_1km_Grid/FL_1km_Grid.shx"
!wget -O /content/model-outputs/FL_1km_Grid/FL_1km_Grid.dbf "https://raw.githubusercontent.com/Ecosystem-Services-GeoAI/FL-CES-Flows-CLIP/main/model-outputs/FL_1km_Grid/FL_1km_Grid.dbf"
!wget -O /content/model-outputs/FL_1km_Grid/FL_1km_Grid.prj "https://raw.githubusercontent.com/Ecosystem-Services-GeoAI/FL-CES-Flows-CLIP/main/model-outputs/FL_1km_Grid/FL_1km_Grid.prj"
!wget -O /content/model-outputs/FL_1km_Grid/FL_1km_Grid.cpg "https://raw.githubusercontent.com/Ecosystem-Services-GeoAI/FL-CES-Flows-CLIP/main/model-outputs/FL_1km_Grid/FL_1km_Grid.cpg"
# download metadata csv
!wget -O /content/model-outputs/Flickr_FL_Predictions_2014_2019_CLIP-BRF-ZS.csv "https://raw.githubusercontent.com/Ecosystem-Services-GeoAI/FL-CES-Flows-CLIP/main/model-outputs/Flickr_FL_Predictions_2014_2019_CLIP-BRF-ZS.csv"
--2026-04-22 16:19:22-- https://raw.githubusercontent.com/Ecosystem-Services-GeoAI/FL-CES-Flows-CLIP/main/model-outputs/FL_1km_Grid/FL_1km_Grid.shp Resolving raw.githubusercontent.com (raw.githubusercontent.com)... 185.199.108.133, 185.199.109.133, 185.199.110.133, ... Connecting to raw.githubusercontent.com (raw.githubusercontent.com)|185.199.108.133|:443... connected. HTTP request sent, awaiting response... 200 OK Length: 25761244 (25M) [application/octet-stream] Saving to: ‘/content/model-outputs/FL_1km_Grid/FL_1km_Grid.shp’ /content/model-outp 100%[===================>] 24.57M 56.9MB/s in 0.4s 2026-04-22 16:19:24 (56.9 MB/s) - ‘/content/model-outputs/FL_1km_Grid/FL_1km_Grid.shp’ saved [25761244/25761244] --2026-04-22 16:19:25-- https://raw.githubusercontent.com/Ecosystem-Services-GeoAI/FL-CES-Flows-CLIP/main/model-outputs/FL_1km_Grid/FL_1km_Grid.shx Resolving raw.githubusercontent.com (raw.githubusercontent.com)... 185.199.109.133, 185.199.111.133, 185.199.108.133, ... Connecting to raw.githubusercontent.com (raw.githubusercontent.com)|185.199.109.133|:443... connected. HTTP request sent, awaiting response... 200 OK Length: 1495892 (1.4M) [application/octet-stream] Saving to: ‘/content/model-outputs/FL_1km_Grid/FL_1km_Grid.shx’ /content/model-outp 100%[===================>] 1.43M 7.78MB/s in 0.2s 2026-04-22 16:19:25 (7.78 MB/s) - ‘/content/model-outputs/FL_1km_Grid/FL_1km_Grid.shx’ saved [1495892/1495892] --2026-04-22 16:19:25-- https://raw.githubusercontent.com/Ecosystem-Services-GeoAI/FL-CES-Flows-CLIP/main/model-outputs/FL_1km_Grid/FL_1km_Grid.dbf Resolving raw.githubusercontent.com (raw.githubusercontent.com)... 185.199.108.133, 185.199.110.133, 185.199.109.133, ... Connecting to raw.githubusercontent.com (raw.githubusercontent.com)|185.199.108.133|:443... connected. HTTP request sent, awaiting response... 200 OK Length: 21876152 (21M) [application/octet-stream] Saving to: ‘/content/model-outputs/FL_1km_Grid/FL_1km_Grid.dbf’ /content/model-outp 100%[===================>] 20.86M 52.3MB/s in 0.4s 2026-04-22 16:19:27 (52.3 MB/s) - ‘/content/model-outputs/FL_1km_Grid/FL_1km_Grid.dbf’ saved [21876152/21876152] --2026-04-22 16:19:28-- https://raw.githubusercontent.com/Ecosystem-Services-GeoAI/FL-CES-Flows-CLIP/main/model-outputs/FL_1km_Grid/FL_1km_Grid.prj Resolving raw.githubusercontent.com (raw.githubusercontent.com)... 185.199.111.133, 185.199.108.133, 185.199.109.133, ... Connecting to raw.githubusercontent.com (raw.githubusercontent.com)|185.199.111.133|:443... connected. HTTP request sent, awaiting response... 200 OK Length: 402 [text/plain] Saving to: ‘/content/model-outputs/FL_1km_Grid/FL_1km_Grid.prj’ /content/model-outp 100%[===================>] 402 --.-KB/s in 0s 2026-04-22 16:19:28 (8.94 MB/s) - ‘/content/model-outputs/FL_1km_Grid/FL_1km_Grid.prj’ saved [402/402] --2026-04-22 16:19:28-- https://raw.githubusercontent.com/Ecosystem-Services-GeoAI/FL-CES-Flows-CLIP/main/model-outputs/FL_1km_Grid/FL_1km_Grid.cpg Resolving raw.githubusercontent.com (raw.githubusercontent.com)... 185.199.109.133, 185.199.110.133, 185.199.108.133, ... Connecting to raw.githubusercontent.com (raw.githubusercontent.com)|185.199.109.133|:443... connected. HTTP request sent, awaiting response... 200 OK Length: 5 [text/plain] Saving to: ‘/content/model-outputs/FL_1km_Grid/FL_1km_Grid.cpg’ /content/model-outp 100%[===================>] 5 --.-KB/s in 0s 2026-04-22 16:19:28 (87.6 KB/s) - ‘/content/model-outputs/FL_1km_Grid/FL_1km_Grid.cpg’ saved [5/5] --2026-04-22 16:19:28-- https://raw.githubusercontent.com/Ecosystem-Services-GeoAI/FL-CES-Flows-CLIP/main/model-outputs/Flickr_FL_Predictions_2014_2019_CLIP-BRF-ZS.csv Resolving raw.githubusercontent.com (raw.githubusercontent.com)... 185.199.108.133, 185.199.109.133, 185.199.110.133, ... Connecting to raw.githubusercontent.com (raw.githubusercontent.com)|185.199.108.133|:443... connected. HTTP request sent, awaiting response... 200 OK Length: 60637853 (58M) [text/plain] Saving to: ‘/content/model-outputs/Flickr_FL_Predictions_2014_2019_CLIP-BRF-ZS.csv’ /content/model-outp 100%[===================>] 57.83M 76.0MB/s in 0.8s 2026-04-22 16:19:33 (76.0 MB/s) - ‘/content/model-outputs/Flickr_FL_Predictions_2014_2019_CLIP-BRF-ZS.csv’ saved [60637853/60637853]
Configure pararmters
gridPath = "/content/model-outputs/FL_1km_Grid/FL_1km_Grid.shp"
gridID = "id"
metaPath = "/content/model-outputs/Flickr_FL_Predictions_2014_2019_CLIP-BRF-ZS.csv"
predLabel = "CLIP-BRF-ZS"
savePath = "/content/Spatial_PUD_Res"
import os
os.makedirs("/content/Spatial_PUD_Res", exist_ok=True)
os.makedirs("/content/Spatial_PUD_Res/PUD_shapefiles", exist_ok=True)
Data preprocessing
#"../RF_CLIP_BinaryClass_Other&CES_RunAllFL/CLIP_RF_RunFL//ALL_FL_Predictions_Thresholds_NLCD2023_RF_CorrectPred_combined.csv"
metadata = pd.read_csv(
metaPath
)
# keep only selected years
metadata["takendate"] = pd.to_datetime(metadata["takendate"], errors="coerce")
selected_years = [2014, 2015, 2016, 2017, 2018, 2019]
metadata = metadata[metadata.takendate.dt.year.isin(selected_years)]
# build GeoDataFrame with correct CRS (WGS84 degrees)
geo_df = gpd.GeoDataFrame(
metadata,
geometry=gpd.points_from_xy(metadata.longitude, metadata.latitude),
crs="EPSG:4326"
)
print(metadata.head(10))
ownerid latitude longitude takendate SITE_NAME PARKNAME \
0 u_58447452f80773de 26.775293 -80.139687 2016-11-13 NaN NaN
1 u_c814148b8e0ad9f7 28.415787 -81.574615 2016-10-27 NaN NaN
2 u_15dd79447333ba27 28.419472 -81.582664 2016-11-13 NaN NaN
3 u_15dd79447333ba27 28.417894 -81.583611 2016-11-13 NaN NaN
4 u_a800241ad14d8372 27.772512 -82.637871 2016-11-14 NaN NaN
5 u_a800241ad14d8372 27.772512 -82.637871 2016-11-11 NaN NaN
6 u_a800241ad14d8372 27.772512 -82.637871 2016-11-14 NaN NaN
7 u_a800241ad14d8372 27.772512 -82.637871 2016-11-14 NaN NaN
8 u_a800241ad14d8372 27.806520 -82.756363 2016-11-14 NaN NaN
9 u_a800241ad14d8372 27.806520 -82.756363 2016-11-14 NaN NaN
Park_Name IUCN_Cat NAME20 NLCD_2023 \
0 NaN NaN NaN 22
1 NaN NaN NaN 23
2 NaN NaN NaN 23
3 NaN NaN NaN 22
4 Williams Park Unassigned Tampa--St. Petersburg, FL 22
5 Williams Park Unassigned Tampa--St. Petersburg, FL 22
6 Williams Park Unassigned Tampa--St. Petersburg, FL 22
7 Williams Park Unassigned Tampa--St. Petersburg, FL 22
8 Abercrombie Park Unassigned Tampa--St. Petersburg, FL 90
9 Abercrombie Park Unassigned Tampa--St. Petersburg, FL 90
CLIP-BRF-ZS
0 Wildlife_Viewing
1 Other
2 Other
3 Boating
4 Other
5 Other
6 Other
7 Other
8 Other
9 Landscape_Aesthetics
grid_gdf = gpd.read_file(gridPath)
grid_gdf[gridID] = grid_gdf[gridID].astype(str)
# reproject points to grid CRS (UTM meters)
geo_df = geo_df.to_crs(grid_gdf.crs)
# spatial join
joined_gdf = gpd.sjoin(geo_df, grid_gdf, how="left", predicate="within")
#Add PUD_ID column
joined_gdf['PUD_ID'] = joined_gdf['ownerid'].astype(str) + '_' + joined_gdf['takendate'].astype(str) + '_' + joined_gdf[gridID].astype(str)
joined_gdf['ownerid_ID'] = joined_gdf['ownerid'].astype(str) + '_' + joined_gdf[gridID].astype(str)
joined_gdf[gridID] = joined_gdf[gridID].astype(str)
# Print just the column names
print(joined_gdf.columns)
# Or view the first few rows to check both column names and some values
print(joined_gdf.head(10))
Index(['ownerid', 'latitude', 'longitude', 'takendate', 'SITE_NAME',
'PARKNAME', 'Park_Name', 'IUCN_Cat', 'NAME20', 'NLCD_2023',
'CLIP-BRF-ZS', 'geometry', 'index_right', 'id', 'left', 'top', 'right',
'bottom', 'PUD_ID', 'ownerid_ID'],
dtype='object')
ownerid latitude longitude takendate SITE_NAME PARKNAME \
0 u_58447452f80773de 26.775293 -80.139687 2016-11-13 NaN NaN
1 u_c814148b8e0ad9f7 28.415787 -81.574615 2016-10-27 NaN NaN
2 u_15dd79447333ba27 28.419472 -81.582664 2016-11-13 NaN NaN
3 u_15dd79447333ba27 28.417894 -81.583611 2016-11-13 NaN NaN
4 u_a800241ad14d8372 27.772512 -82.637871 2016-11-14 NaN NaN
5 u_a800241ad14d8372 27.772512 -82.637871 2016-11-11 NaN NaN
6 u_a800241ad14d8372 27.772512 -82.637871 2016-11-14 NaN NaN
7 u_a800241ad14d8372 27.772512 -82.637871 2016-11-14 NaN NaN
8 u_a800241ad14d8372 27.806520 -82.756363 2016-11-14 NaN NaN
9 u_a800241ad14d8372 27.806520 -82.756363 2016-11-14 NaN NaN
Park_Name IUCN_Cat NAME20 NLCD_2023 \
0 NaN NaN NaN 22
1 NaN NaN NaN 23
2 NaN NaN NaN 23
3 NaN NaN NaN 22
4 Williams Park Unassigned Tampa--St. Petersburg, FL 22
5 Williams Park Unassigned Tampa--St. Petersburg, FL 22
6 Williams Park Unassigned Tampa--St. Petersburg, FL 22
7 Williams Park Unassigned Tampa--St. Petersburg, FL 22
8 Abercrombie Park Unassigned Tampa--St. Petersburg, FL 90
9 Abercrombie Park Unassigned Tampa--St. Petersburg, FL 90
CLIP-BRF-ZS geometry index_right \
0 Wildlife_Viewing POINT (585527.084 2961836.589) 184823.0
1 Other POINT (443720.179 3143396.895) 118543.0
2 Other POINT (442933.793 3143808.926) 117929.0
3 Boating POINT (442840.288 3143634.625) 117930.0
4 Other POINT (338610.961 3073077.874) 64391.0
5 Other POINT (338610.961 3073077.874) 64391.0
6 Other POINT (338610.961 3073077.874) 64391.0
7 Other POINT (338610.961 3073077.874) 64391.0
8 Other POINT (326987.091 3077007.233) 59662.0
9 Landscape_Aesthetics POINT (326987.091 3077007.233) 59662.0
id left top right bottom \
0 570496.0 585241.855509 2.962671e+06 586241.855509 2.961671e+06
1 463673.0 443241.855509 3.143671e+06 444241.855509 3.142671e+06
2 462921.0 442241.855509 3.144671e+06 443241.855509 3.143671e+06
3 462922.0 442241.855509 3.143671e+06 443241.855509 3.142671e+06
4 384888.0 338241.855509 3.073671e+06 339241.855509 3.072671e+06
5 384888.0 338241.855509 3.073671e+06 339241.855509 3.072671e+06
6 384888.0 338241.855509 3.073671e+06 339241.855509 3.072671e+06
7 384888.0 338241.855509 3.073671e+06 339241.855509 3.072671e+06
8 375872.0 326241.855509 3.077671e+06 327241.855509 3.076671e+06
9 375872.0 326241.855509 3.077671e+06 327241.855509 3.076671e+06
PUD_ID ownerid_ID
0 u_58447452f80773de_2016-11-13_570496.0 u_58447452f80773de_570496.0
1 u_c814148b8e0ad9f7_2016-10-27_463673.0 u_c814148b8e0ad9f7_463673.0
2 u_15dd79447333ba27_2016-11-13_462921.0 u_15dd79447333ba27_462921.0
3 u_15dd79447333ba27_2016-11-13_462922.0 u_15dd79447333ba27_462922.0
4 u_a800241ad14d8372_2016-11-14_384888.0 u_a800241ad14d8372_384888.0
5 u_a800241ad14d8372_2016-11-11_384888.0 u_a800241ad14d8372_384888.0
6 u_a800241ad14d8372_2016-11-14_384888.0 u_a800241ad14d8372_384888.0
7 u_a800241ad14d8372_2016-11-14_384888.0 u_a800241ad14d8372_384888.0
8 u_a800241ad14d8372_2016-11-14_375872.0 u_a800241ad14d8372_375872.0
9 u_a800241ad14d8372_2016-11-14_375872.0 u_a800241ad14d8372_375872.0
joined_gdf_excludeNoCES = joined_gdf[joined_gdf[predLabel]!='Other']
len(joined_gdf_excludeNoCES)
310773
joined_gdf.drop(columns='geometry').to_csv("/content/model-outputs/Flickr_FL_Predictions_2014_2019_CLIP-BRF-ZS_1kmGrids.csv", index=False)
Compute Unqiue users and PUD Intenstiy
def avgPUDsyearly(years_to_filter, joined_gdf_excludeNoCES, saveName, sta=False):
# parameters
# gridPath = 'FL_1km_Grid/FL_1km_Grid.shp'
# gridID = 'id'
# predLable = 'RF_Correct_Pred' ###par
# Define the list of years you want to filter
#years_to_filter = [2014, 2015, 2016, 2017, 2018, 2019]
# Filter the GeoDataFrame for rows where the year in 'takendate' is in the list of years
filtered_gdf = joined_gdf_excludeNoCES[joined_gdf_excludeNoCES['takendate'].dt.year.isin(years_to_filter)]
owner_counts = filtered_gdf.groupby(gridID)['ownerid_ID'].nunique().reset_index(name='unique_owner_counts') ##UniqueOwner
copy_grid_gdf = grid_gdf.copy()
gdf_regions_with_counts = copy_grid_gdf.merge(owner_counts, on=gridID, how='left')
pud_counts = filtered_gdf.groupby(gridID)['PUD_ID'].nunique().reset_index(name='pud_count') ##PUDs
gdf_regions_with_counts = gdf_regions_with_counts.merge(pud_counts, on=gridID, how='left')
fig, ax = plt.subplots(1, 1, figsize=(10, 10))
gdf_regions_with_counts.plot(column='pud_count', ax=ax, legend=True, cmap='inferno_r')
gdf_regions_with_counts['pud_count'] = gdf_regions_with_counts['pud_count'].fillna(0)
gdf_regions_with_counts['unique_owner_counts'] = gdf_regions_with_counts['unique_owner_counts'].fillna(0)
# Calculate index
gdf_regions_with_counts['Total_pud'] = gdf_regions_with_counts['pud_count']
gdf_regions_with_counts['Total_pud'] = gdf_regions_with_counts['Total_pud'].fillna(0)
gdf_regions_with_counts['Avg_pud'] = gdf_regions_with_counts['pud_count'] / len(years_to_filter)
gdf_regions_with_counts['Avg_pud'] = gdf_regions_with_counts['Avg_pud'].fillna(0)
gdf_regions_with_counts['Avg_pud_des'] = gdf_regions_with_counts['pud_count'] / len(years_to_filter) / gdf_regions_with_counts['unique_owner_counts']
gdf_regions_with_counts['Avg_pud_des'] = gdf_regions_with_counts['Avg_pud_des'].fillna(0)
os.makedirs(f"./{savePath}/PUD_shapefiles/", exist_ok=True)
gdf_regions_with_counts.to_file(f'./{savePath}/PUD_shapefiles/PUD_{saveName}.shp', driver='ESRI Shapefile')
#plt.show()
plt.close(fig)
if sta:
# Define the list of years you want to filter
Res = {'Year':[],'Jan.-Mar.':[],'Apr.-Jun.':[],'Jul.-Sep.':[],'Oct.-Dec.':[]}
month_to_filter = [[1,2,3],[4,5,6],[7,8,9],[10,11,12]]
for m in month_to_filter:
# Filter the GeoDataFrame for rows where the year in 'takendate' is in the list of years
filtered_month_gdf = joined_gdf_excludeNoCES[joined_gdf_excludeNoCES['takendate'].dt.month.isin(m)]
for y in years_to_filter:
year_month_df = filtered_month_gdf[filtered_month_gdf['takendate'].dt.year == y]
unique_pud_count = year_month_df['ownerid_ID'].nunique()
#print(m, len(year_month_df))
if y not in Res['Year']:
Res['Year'].append(y)
if m == [1,2,3]:
Res['Jan.-Mar.'].append(unique_pud_count)
if m == [4,5,6]:
Res['Apr.-Jun.'].append(unique_pud_count)
if m == [7,8,9]:
Res['Jul.-Sep.'].append(unique_pud_count)
if m == [10,11,12]:
Res['Oct.-Dec.'].append(unique_pud_count)
os.makedirs(f"./{savePath}/PUD_Metadata/", exist_ok=True)
pd.DataFrame(Res).to_excel(f'{savePath}/PUD_Metadata/UniqueOwner_{saveName}_count_year_month.xlsx', index=False)
# Define the list of years you want to filter
Res = {'Year':[],'Jan.-Mar.':[],'Apr.-Jun.':[],'Jul.-Sep.':[],'Oct.-Dec.':[]}
month_to_filter = [[1,2,3],[4,5,6],[7,8,9],[10,11,12]]
for m in month_to_filter:
# Filter the GeoDataFrame for rows where the year in 'takendate' is in the list of years
filtered_month_gdf = joined_gdf_excludeNoCES[joined_gdf_excludeNoCES['takendate'].dt.month.isin(m)]
for y in years_to_filter:
year_month_df = filtered_month_gdf[filtered_month_gdf['takendate'].dt.year == y]
unique_pud_count = year_month_df['PUD_ID'].nunique()
#print(m, len(year_month_df))
if y not in Res['Year']:
Res['Year'].append(y)
if m == [1,2,3]:
Res['Jan.-Mar.'].append(unique_pud_count)
if m == [4,5,6]:
Res['Apr.-Jun.'].append(unique_pud_count)
if m == [7,8,9]:
Res['Jul.-Sep.'].append(unique_pud_count)
if m == [10,11,12]:
Res['Oct.-Dec.'].append(unique_pud_count)
pd.DataFrame(Res).to_excel(f'{savePath}/PUD_Metadata/PUDs_{saveName}_count_year_month.xlsx', index=False)
def avgPUDsyearlyEArec(years_to_filter, joined_gdf_excludeNoCES, saveName, predictor):
class_names = [
"Biking", "Boating", "Camping", "Fishing", "Hiking", "Horseback_Riding",
"Hunting", "Shelling", "Surfing", "Swimming", "Wildlife_Viewing",
"Landscape_Aesthetics", "Other"
]
Res = {'Year': [], 'CES Class': [], 'PUDs': [], 'Unique person': [], 'PUDs per unique person': []}
Res2 = {'Year': years_to_filter}
for cla in class_names:
Res2[cla] = []
for yr in years_to_filter:
# Filter by year and CES class
filtered = joined_gdf_excludeNoCES[
(joined_gdf_excludeNoCES['takendate'].dt.year == yr) &
(joined_gdf_excludeNoCES[predictor] == cla)
]
unique_pud_count = filtered['PUD_ID'].nunique()
unique_owner_count = filtered['ownerid_ID'].nunique()
puds_per_person = unique_pud_count / unique_owner_count if unique_owner_count else 0
Res['Year'].append(yr)
Res['CES Class'].append(cla)
Res['PUDs'].append(unique_pud_count)
Res['Unique person'].append(unique_owner_count)
Res['PUDs per unique person'].append(puds_per_person)
Res2[cla].append(puds_per_person)
pd.DataFrame(Res).to_excel(f'/content/model-outputs/PUDs_density_{saveName}_count_yearly_part1_.xlsx', index=False)
pd.DataFrame(Res2).to_excel(f'/content/model-outputs/PUDs_density_{saveName}_count_yearly_part2_.xlsx', index=False)
joined_gdf_excludeNoCES = joined_gdf[joined_gdf[predLabel]!='Other']
len(joined_gdf_excludeNoCES), predLabel
(310773, 'CLIP-BRF-ZS')
years_to_filter = [2014, 2015, 2016, 2017, 2018, 2019]
avgPUDsyearlyEArec(years_to_filter, joined_gdf, 'OverAll_201401-201912', predLabel)
joined_gdf_onlyHumanAct = joined_gdf[
(joined_gdf[predLabel] != 'Wildlife_Viewing') &
(joined_gdf[predLabel] != 'Landscape_Aesthetics') &
(joined_gdf[predLabel] != 'Other')
]
len(joined_gdf_onlyHumanAct)
71486
joined_gdf_wildlife = joined_gdf[joined_gdf[predLabel] == 'Wildlife_Viewing']
len(joined_gdf_wildlife)
172154
joined_gdf_landscae = joined_gdf[joined_gdf[predLabel] == 'Landscape_Aesthetics']
len(joined_gdf_landscae)
67133
joined_gdf_onlyHumanAct.columns
Index(['ownerid', 'latitude', 'longitude', 'takendate', 'SITE_NAME',
'PARKNAME', 'Park_Name', 'IUCN_Cat', 'NAME20', 'NLCD_2023',
'CLIP-BRF-ZS', 'geometry', 'index_right', 'id', 'left', 'top', 'right',
'bottom', 'PUD_ID', 'ownerid_ID'],
dtype='object')
years_to_filter = [2014, 2015, 2016, 2017, 2018, 2019]
avgPUDsyearly(years_to_filter, joined_gdf_onlyHumanAct, 'OverallonlyHumanAct_201401-201912', sta=False)
uni_class = joined_gdf[predLabel].unique()
uni_class
array(['Wildlife_Viewing', 'Other', 'Boating', 'Landscape_Aesthetics',
'Surfing', 'Swimming', 'Biking', 'Hiking', 'Fishing', 'Camping',
'Shelling', 'Horseback_Riding', 'Hunting'], dtype=object)
#Considerate each class
for cla in list(uni_class):
joined_gdf_cla = joined_gdf[joined_gdf[predLabel]==cla]
print(cla, len(joined_gdf_cla))
avgPUDsyearly(years_to_filter, joined_gdf_cla, f'{cla}_201401-201912', sta=False)
Wildlife_Viewing 172154 Other 279605 Boating 15491 Landscape_Aesthetics 67133 Surfing 5000 Swimming 14463 Biking 3360 Hiking 6125 Fishing 6677 Camping 2435 Shelling 11575 Horseback_Riding 2757 Hunting 3603
shp_path = "/content/Spatial_PUD_Res/PUD_shapefiles/PUD_Landscape_Aesthetics_201401-201912.shp"
gdf = gpd.read_file(shp_path)
print(gdf.sort_values("Avg_pud", ascending=False).head(5))
id left top right bottom \
117929 462921.0 442241.855509 3.144671e+06 443241.855509 3.143671e+06
56907 370596.0 319241.855509 3.096671e+06 320241.855509 3.095671e+06
185340 572108.0 587241.855509 2.852671e+06 588241.855509 2.851671e+06
183060 564519.0 577241.855509 2.931671e+06 578241.855509 2.930671e+06
117931 462923.0 442241.855509 3.142671e+06 443241.855509 3.141671e+06
unique_own pud_count Total_pud Avg_pud Avg_pud_de \
117929 145.0 211.0 211.0 35.166667 0.242529
56907 104.0 189.0 189.0 31.500000 0.302885
185340 151.0 178.0 178.0 29.666667 0.196468
183060 16.0 176.0 176.0 29.333333 1.833333
117931 68.0 166.0 166.0 27.666667 0.406863
geometry
117929 POLYGON ((442241.856 3144671.18, 443241.856 31...
56907 POLYGON ((319241.856 3096671.18, 320241.856 30...
185340 POLYGON ((587241.856 2852671.18, 588241.856 28...
183060 POLYGON ((577241.856 2931671.18, 578241.856 29...
117931 POLYGON ((442241.856 3142671.18, 443241.856 31...
CES mapping in spaital PUDs results
import geopandas as gpd
import folium
import branca
import numpy as np
# --------------------------
# 1. Read shapefile
# --------------------------
shp_path = "/content/Spatial_PUD_Res/PUD_shapefiles/PUD_Landscape_Aesthetics_201401-201912.shp"
gdf = gpd.read_file(shp_path).to_crs(epsg=4326)
# change this to your real value column
value_col = "Avg_pud_de"
# keep only nonzero values
gdf = gdf[(gdf[value_col].notna()) & (gdf[value_col] > 0)].copy()
# --------------------------
# 2. Set class breaks
# --------------------------
bins = [0.001, 0.167, 0.333, 0.667, 1.000, 15.000]
# 5 colors for 5 classes
colors = [
"#d8ece8",
"#a8d9cf",
"#6fc4af",
"#2faa63",
"#007a2f"
]
# --------------------------
# 3. Function to assign color
# --------------------------
def get_color(val):
if 0.001 <= val <= 0.167:
return colors[0]
elif 0.167 < val <= 0.333:
return colors[1]
elif 0.333 < val <= 0.667:
return colors[2]
elif 0.667 < val <= 1.000:
return colors[3]
elif 1.000 < val <= 15.000:
return colors[4]
else:
return "#00000000" # transparent
print(gdf.head())
print(gdf.crs)
print(gdf.columns)
id left top right bottom \
372 37630.0 -123758.144491 3.369671e+06 -122758.144491 3.368671e+06
373 37631.0 -123758.144491 3.368671e+06 -122758.144491 3.367671e+06
484 39132.0 -121758.144491 3.369671e+06 -120758.144491 3.368671e+06
508 39811.0 -120758.144491 3.441671e+06 -119758.144491 3.440671e+06
538 39876.0 -120758.144491 3.376671e+06 -119758.144491 3.375671e+06
unique_own pud_count Total_pud Avg_pud Avg_pud_de \
372 2.0 2.0 2.0 0.333333 0.166667
373 1.0 1.0 1.0 0.166667 0.166667
484 1.0 1.0 1.0 0.166667 0.166667
508 1.0 1.0 1.0 0.166667 0.166667
538 1.0 1.0 1.0 0.166667 0.166667
geometry
372 POLYGON ((-87.46945 30.29579, -87.46905 30.289...
373 POLYGON ((-87.47938 30.28923, -87.46905 30.289...
484 POLYGON ((-87.45544 30.29941, -87.44897 30.299...
508 POLYGON ((-87.4921 30.94529, -87.4817 30.94581...
538 POLYGON ((-87.45128 30.354, -87.45138 30.3549,...
EPSG:4326
Index(['id', 'left', 'top', 'right', 'bottom', 'unique_own', 'pud_count',
'Total_pud', 'Avg_pud', 'Avg_pud_de', 'geometry'],
dtype='object')
"""
ColorBrewer is a great source for map colors.
"""
from IPython.display import IFrame
IFrame(
src="https://colorbrewer2.org/#type=sequential&scheme=BuGn&n=3",
width="100%",
height=600
)
# --------------------------
# 4. Create map
# --------------------------
center = gdf.geometry.union_all().centroid
# m = folium.Map(location=[center.y, center.x], zoom_start=10, tiles="OpenStreetMap")
m = folium.Map(
location=[center.y, center.x],
zoom_start=10,
tiles="CartoDB Voyager"
)
# style function
def style_function(feature):
val = feature["properties"][value_col]
return {
"fillColor": get_color(val),
"color": "black",
"weight": 1,
"fillOpacity": 0.75,
}
tooltip_fields = [value_col] if value_col in gdf.columns else None
folium.GeoJson(
gdf,
style_function=style_function,
tooltip=folium.GeoJsonTooltip(
fields=tooltip_fields,
aliases=[value_col],
localize=True
)
).add_to(m)
# --------------------------
# 5. Custom legend
# --------------------------
legend_html = """
<div style="
position: fixed;
bottom: 40px;
left: 40px;
width: 180px;
z-index: 9999;
font-size: 14px;
background-color: white;
border-radius: 8px;
padding: 12px 14px;
box-shadow: 0 2px 6px rgba(0,0,0,0.20);
line-height: 1.2;
">
<div style="
font-weight: bold;
font-size: 16px;
text-align: center;
margin-bottom: 8px;
">
Average Annual<br>PUDs per Person
</div>
<div style="
font-size: 14px;
text-align: center;
margin-bottom: 10px;
">
Landscape Aesthetics
</div>
<div style="display:flex; align-items:center; margin-bottom:5px;">
<span style="display:inline-block; width:20px; height:20px; background:#d8ece8; margin-right:10px;"></span>
0.001 – 0.167
</div>
<div style="display:flex; align-items:center; margin-bottom:5px;">
<span style="display:inline-block; width:20px; height:20px; background:#a8d9cf; margin-right:10px;"></span>
0.168 – 0.333
</div>
<div style="display:flex; align-items:center; margin-bottom:5px;">
<span style="display:inline-block; width:20px; height:20px; background:#6fc4af; margin-right:10px;"></span>
0.334 – 0.667
</div>
<div style="display:flex; align-items:center; margin-bottom:5px;">
<span style="display:inline-block; width:20px; height:20px; background:#2faa63; margin-right:10px;"></span>
0.668 – 1.000
</div>
<div style="display:flex; align-items:center;">
<span style="display:inline-block; width:20px; height:20px; background:#007a2f; margin-right:10px;"></span>
1.001 – 15.000
</div>
</div>
"""
m.get_root().html.add_child(folium.Element(legend_html))
m
Mapping NLCD Land Cover/Use
Download NLCD raster
!gdown "https://drive.google.com/uc?id=1ymYc93D_vpzIoMFvl6c_cGxVEhQ773YN"
Downloading... From (original): https://drive.google.com/uc?id=1ymYc93D_vpzIoMFvl6c_cGxVEhQ773YN From (redirected): https://drive.google.com/uc?id=1ymYc93D_vpzIoMFvl6c_cGxVEhQ773YN&confirm=t&uuid=825154ac-4d4b-4b36-85ef-c23d6be36532 To: /content/FL_BG2_Annual_NLCD_LndCov_2023_CU_C1V0.tif 100% 640M/640M [00:04<00:00, 137MB/s]
Assign NLCD color, name, and class
# Official NLCD classes commonly used for CONUS
nlcd_classes = {
11: ("Open Water", "#486da2"),
12: ("Perennial Ice/Snow", "#e7eefc"),
21: ("Developed, Open Space", "#e1cdce"),
22: ("Developed, Low Intensity", "#dc9881"),
23: ("Developed, Medium Intensity", "#f10100"),
24: ("Developed, High Intensity", "#ab0101"),
31: ("Barren Land (Rock/Sand/Clay)", "#b3afa4"),
41: ("Deciduous Forest", "#6ca966"),
42: ("Evergreen Forest", "#1d6533"),
43: ("Mixed Forest", "#bdcc93"),
51: ("Dwarf Scrub", "#b19941"),
52: ("Shrub/Scrub", "#d1bb82"),
71: ("Grassland/Herbaceous", "#edeccd"),
72: ("Sedge/Herbaceous", "#d0d181"),
73: ("Lichens", "#a4cc51"),
74: ("Moss", "#82ba9d"),
81: ("Pasture/Hay", "#dcd83d"),
82: ("Cultivated Crops", "#ae7229"),
90: ("Woody Wetlands", "#bbd7ed"),
95: ("Emergent Herbaceous Wetlands", "#71a4c1"),
}
Display NLCD map
import rasterio
from rasterio.enums import Resampling
import numpy as np
import matplotlib.pyplot as plt
import matplotlib.patches as mpatches
from matplotlib.colors import ListedColormap
raster_path = "/content/FL_BG2_Annual_NLCD_LndCov_2023_CU_C1V0.tif"
scale = 8 # larger = smaller output
with rasterio.open(raster_path) as src:
nlcd_small = src.read(
1,
out_shape=(src.height // scale, src.width // scale),
resampling=Resampling.nearest
)
present_values = [v for v in np.unique(nlcd_small) if v in nlcd_classes]
value_to_idx = {v: i for i, v in enumerate(present_values)}
print("shape:", nlcd_small.shape)
print("dtype:", nlcd_small.dtype)
print("unique values (sample):", np.unique(nlcd_small)[:30])
shape: (2953, 3384) dtype: uint8 unique values (sample): [ 11 21 22 23 24 31 41 42 43 52 71 81 82 90 95 250]
plot_arr = np.full(nlcd_small.shape, -1, dtype=np.int16)
for v, i in value_to_idx.items():
plot_arr[nlcd_small == v] = i
colors = [nlcd_classes[v][1] for v in present_values]
cmap = ListedColormap(colors)
masked = np.ma.masked_where(plot_arr < 0, plot_arr)
plt.figure(figsize=(10, 10))
plt.imshow(masked, cmap=cmap, interpolation="nearest")
plt.axis("off")
plt.title("NLCD 2023 Land Cover")
patches = [
mpatches.Patch(color=nlcd_classes[v][1], label=f"{v} {nlcd_classes[v][0]}")
for v in present_values
]
plt.legend(
handles=patches,
loc="center left",
bbox_to_anchor=(1.02, 0.5),
frameon=True,
title="NLCD Classes"
)
plt.tight_layout()
plt.show()

Assign the NLCD class to each Flickr image
raster = rasterio.open(raster_path)
# Reproject to raster CRS if needed
if joined_gdf.crs != raster.crs:
joined_gdf = joined_gdf.to_crs(raster.crs)
# Extract coordinates and sample raster
coords = [(x, y) for x, y in zip(joined_gdf.geometry.x, joined_gdf.geometry.y)]
raster_values = [val[0] for val in raster.sample(coords)]
# Add raster values to GeoDataFrame
joined_gdf["NLCD_2023"] = raster_values
NLCD Percentage
# List of class names
class_names = ["Biking", "Boating", "Camping", "Fishing", "Hiking", "Horseback_Riding",
"Hunting", "Shelling", "Surfing", "Swimming", "Wildlife_Viewing",
"Landscape_Aesthetics", "Other"]
# NLCD class mapping
nlcd_class_map = {
11: "Water", 12: "Water", 21: "Developed", 22: "Developed",
23: "Developed", 24: "Developed", 31: "Barren", 41: "Forest",
42: "Forest", 43: "Forest", 51: "Shrubland", 52: "Shrubland",
71: "Herbaceous", 72: "Herbaceous", 73: "Herbaceous", 74: "Herbaceous",
81: "Pasture/Hay", 82: "Cultivated Crops", 90: "Wetlands", 95: "Wetlands"
}
def NLCD_summary(geo_df):
# Initialize summary DataFrame
summary_total_puds = pd.DataFrame()
summary_total_owns = pd.DataFrame()
summary_avg_puds = pd.DataFrame()
summary_avg_puds_des = pd.DataFrame()
# Loop through each CES class
for cla in class_names:
total_puds_table = geo_df[geo_df[predLabel] == cla].drop_duplicates(subset=['PUD_ID'])
total_owns_table = geo_df[geo_df[predLabel] == cla].drop_duplicates(subset=['ownerid_ID'])
mapped_total_puds = total_puds_table["NLCD_2023"].map(nlcd_class_map).value_counts().sort_index()
mapped_total_owns = total_owns_table["NLCD_2023"].map(nlcd_class_map).value_counts().sort_index()
mapped_avg_puds = mapped_total_puds / len(years_to_filter) if len(years_to_filter) > 0 else 0
mapped_avg_puds_des = {}
# Create new columns with renamed NLCD classes
total_puds_table["NLCD_rename"] = total_puds_table["NLCD_2023"].map(nlcd_class_map)
total_owns_table["NLCD_rename"] = total_owns_table["NLCD_2023"].map(nlcd_class_map)
nlcd_order = [
"Developed",
"Wetlands",
"Water",
"Pasture/Hay",
"Barren",
"Forest",
"Cultivated Crops",
"Herbaceous",
"Shrubland"
]
for cat in nlcd_order:
# Filter for current class
puds_filtered = total_puds_table[total_puds_table["NLCD_rename"] == cat]
owns_filtered = total_owns_table[total_owns_table["NLCD_rename"] == cat]
# Count occurrences per id
total_puds_id = puds_filtered["id"].value_counts()
total_owner_id = owns_filtered["id"].value_counts()
# Align IDs and compute ratio safely
avg_puds_des_id = (
(total_puds_id / total_owner_id).fillna(0) / len(years_to_filter)
if len(years_to_filter) > 0 else pd.Series(dtype=float)
)
mapped_avg_puds_des[cat] = avg_puds_des_id.mean()
# Convert to DataFrame
df_total_puds = mapped_total_puds.reset_index()
df_total_puds.columns = ['class', f'{cla}_count']
df_total_own = mapped_total_owns.reset_index()
df_total_own.columns = ['class', f'{cla}_count']
df_avg_puds = mapped_avg_puds.reset_index()
df_avg_puds.columns = ['class', f'{cla}_count']
df_avg_puds_des = pd.Series(mapped_avg_puds_des).reset_index()
df_avg_puds_des.columns = ['class', f'{cla}_count']
total_total_puds = df_total_puds[f'{cla}_count'].sum()
df_total_puds[f'{cla}_percentage'] = (df_total_puds[f'{cla}_count'] / total_total_puds * 100).fillna(0).round(2)
total_total_own = df_total_own[f'{cla}_count'].sum()
df_total_own[f'{cla}_percentage'] = (df_total_own[f'{cla}_count'] / total_total_own * 100).fillna(0).round(2)
total_avg_puds = df_avg_puds[f'{cla}_count'].sum()
df_avg_puds[f'{cla}_percentage'] = (df_avg_puds[f'{cla}_count'] / total_avg_puds * 100).fillna(0).round(2)
total_avg_puds_des = df_avg_puds_des[f'{cla}_count'].sum()
df_avg_puds_des[f'{cla}_percentage'] = (df_avg_puds_des[f'{cla}_count'] / total_avg_puds_des * 100).fillna(0).round(2)
# Merge into the summary
if summary_total_puds.empty:
summary_total_puds = df_total_puds
else:
summary_total_puds = pd.merge(summary_total_puds, df_total_puds, on='class', how='outer', sort=False)
if summary_total_owns.empty:
summary_total_owns = df_total_own
else:
summary_total_owns = pd.merge(summary_total_owns, df_total_own, on='class', how='outer', sort=False)
if summary_avg_puds.empty:
summary_avg_puds = df_avg_puds
else:
summary_avg_puds = pd.merge(summary_avg_puds, df_avg_puds, on='class', how='outer', sort=False)
if summary_avg_puds_des.empty:
summary_avg_puds_des = df_avg_puds_des
else:
summary_avg_puds_des = pd.merge(summary_avg_puds_des, df_avg_puds_des, on='class', how='outer', sort=False)
#print(mapped_avg_puds_des)
# Fill missing values
summary_total_puds = summary_total_puds.fillna(0)
summary_total_owns = summary_total_owns.fillna(0)
summary_avg_puds = summary_avg_puds.fillna(0)
summary_avg_puds_des = summary_avg_puds_des.fillna(0)
return summary_total_puds, summary_total_owns, summary_avg_puds, summary_avg_puds_des
def reshape_summary(summary_df, tag):
"""
Reshape one summary DataFrame into wide format with counts + percentages.
tag = "Total_PUDs", "Total_Owns", "Avg_PUDs", "Avg_PUDs_Des"
"""
# Step 1: Set class index
df = summary_df.set_index("class")
# Step 2: Split count and percentage parts
count_df = df.filter(like="_count").T
percentage_df = df.filter(like="_percentage").T
# Step 3: Clean row labels
count_df.index = count_df.index.str.replace("_count", "")
percentage_df.index = percentage_df.index.str.replace("_percentage", "")
# Step 4: Add suffixes to columns so we don’t lose CES activity meaning
count_df.columns = [f"{col}_count" for col in count_df.columns]
percentage_df.columns = [f"{col}_percentage" for col in percentage_df.columns]
# Step 5: Combine
final_df = pd.concat([count_df, percentage_df], axis=1)
# Step 6: Reorder by NLCD order
nlcd_order = [
"Developed",
"Wetlands",
"Water",
"Pasture/Hay",
"Barren",
"Forest",
"Cultivated Crops",
"Herbaceous",
"Shrubland"
]
count_cols_sorted = [f"{cls}_count" for cls in nlcd_order if f"{cls}_count" in final_df.columns]
percent_cols_sorted = [f"{cls}_percentage" for cls in nlcd_order if f"{cls}_percentage" in final_df.columns]
final_df = final_df[count_cols_sorted + percent_cols_sorted]
return final_df
summary_total_puds, summary_total_owns, summary_avg_puds, summary_avg_puds_des = NLCD_summary(joined_gdf)
# Apply to all four
final_total_puds = reshape_summary(summary_total_puds, "Total_PUDs")
final_total_owns = reshape_summary(summary_total_owns, "Total_Owns")
final_avg_puds = reshape_summary(summary_avg_puds, "Avg_PUDs")
final_avg_puds_des = reshape_summary(summary_avg_puds_des, "Avg_PUDs_Des")
# --- Save to Excel with four sheets ---
with pd.ExcelWriter("/content/CES_NLCD_percentages.xlsx", engine="openpyxl") as writer:
final_total_puds.to_excel(writer, sheet_name="Total_PUDs")
final_total_owns.to_excel(writer, sheet_name="Total_Owns")
final_avg_puds.to_excel(writer, sheet_name="Avg_PUDs")
final_avg_puds_des.to_excel(writer, sheet_name="Avg_PUDs_Des")
Plot CES prediction in NLCD
import pandas as pd
import matplotlib.pyplot as plt
import numpy as np
# -----------------------------
# 1. Use only these categories
# -----------------------------
count_cols = [
"Wetlands_count",
"Water_count",
"Pasture/Hay_count",
"Barren_count",
"Forest_count",
"Cultivated Crops_count",
"Herbaceous_count",
"Shrubland_count",
]
legend_labels = [
"Wetlands",
"Water",
"Pasture/Hay",
"Barren",
"Forest",
"Cultivated Crops",
"Herbaceous",
"Shrubland",
]
colors = {
"Wetlands": "#bcd5e6",
"Water": "#5a7db3",
"Pasture/Hay": "#efe74a",
"Barren": "#d6d1c2",
"Forest": "#84c67a",
"Cultivated Crops": "#d39a43",
"Herbaceous": "#efe1a0",
"Shrubland": "#d8c47a",
}
# -----------------------------
# 2. Recalculate total + percentages
# -----------------------------
plot_df = final_avg_puds.copy()
plot_df["Total_recalc"] = plot_df[count_cols].sum(axis=1)
for col in count_cols:
plot_df[col.replace("_count", "_pct_recalc")] = (
plot_df[col] / plot_df["Total_recalc"] * 100
)
# -----------------------------
# 3. Keep activity rows only
# -----------------------------
plot_data = plot_df.loc[
[
"Biking", "Boating", "Camping", "Fishing", "Hiking",
"Horseback_Riding", "Hunting", "Shelling", "Surfing",
"Swimming", "Wildlife_Viewing", "Landscape_Aesthetics"
]
].copy()
plot_data.index = [
"Biking", "Boating", "Camping", "Fishing", "Hiking",
"Horseback Riding", "Hunting", "Shelling", "Surfing",
"Swimming", "Wildlife Viewing", "Landscape Aesthetics"
]
pct_cols = [c.replace("_count", "_pct_recalc") for c in count_cols]
data = plot_data[pct_cols] / 100.0
# -----------------------------
# 4. Draw 100% stacked bar chart
# -----------------------------
fig, ax = plt.subplots(figsize=(12, 7), dpi=300)
bottom = np.zeros(len(data))
for col, label in zip(pct_cols, legend_labels):
vals = data[col].values
ax.bar(
data.index,
vals,
bottom=bottom,
label=label,
color=colors[label],
edgecolor="0.35",
linewidth=0.6,
width=0.72,
)
bottom += vals
ax.set_ylim(0, 1)
ax.set_yticks(np.linspace(0, 1, 6))
ax.set_yticklabels([f"{int(v*100)}%" for v in np.linspace(0, 1, 6)])
ax.set_xlabel("")
ax.set_ylabel("")
plt.xticks(rotation=45, ha="right")
# leave room only below
fig.subplots_adjust(bottom=0.28)
# figure-level legend below plot
fig.legend(
loc="lower center",
bbox_to_anchor=(0.5, 0.02),
ncol=3,
frameon=False,
fontsize=11,
columnspacing=1.8,
handletextpad=0.6
)
fig.savefig("/content/CES_LULC_Pred.png", dpi=300, bbox_inches="tight")
plt.close(fig)
from IPython.display import Image, display
display(Image("/content/CES_LULC_Pred.png"))

Additional Resources
Florida Cultural Ecosystem Services (CES) Flow Explorer
from IPython.display import IFrame
IFrame(
src="https://es-geoai.rc.ufl.edu/FL-CES-Flows-CLIP/",
width="100%",
height=600
)
Summary and Next Steps
Congratulations! You have completed a hands-on introduction to mapping cultural ecosystem service (CES) flows using geotagged Flickr images, geospatial analysis, and CLIP-based vision-language models. This notebook introduced a practical workflow for connecting social media imagery, landscape context, and decision-support mapping.
What We Accomplished
1. CES Mapping Workflow
- worked with geotagged Flickr images as a proxy for human–nature interactions
- prepared image metadata and linked it to spatial context
- organized an end-to-end workflow from data input to CES flow mapping
2. CLIP-Based Image Classification
- explored how vision-language models can support CES classification
- applied a CLIP-based workflow for identifying multiple CES classes
- demonstrated how low-label and hybrid modeling strategies can support scalable CES mapping
3. Spatial Analysis and Landscape Context
- filtered observations to relevant natural and working landscapes
- linked classified CES flows to land-use/land-cover classes
- summarized how different landscape types contribute to CES delivery
4. CES Flow Quantification and Visualization
- used photo-user-days to quantify CES flows
- summarized activity-specific patterns across landscape categories
- created tables, stacked bar charts, and maps to support interpretation and communication
5. Decision-Support Applications
- identified CES hotspots and spatial patterns across Florida
- examined how urban greenspaces, parks, protected areas, and other landscapes support CES flows
- demonstrated how GeoAI workflows can support ecosystem-service assessment and decision making
Key Takeaway Messages
- Social media imagery can provide valuable evidence of realized human–nature interactions at broad spatial scales.
- Vision-language models such as CLIP offer a promising, label-efficient approach for CES classification.
- Combining image classification with geospatial analysis helps connect human activity patterns to landscape context.
- CES maps and summary figures can support planning, conservation, and natural resource management.
- Reproducible notebook workflows make these methods more accessible for research, education, and applied decision making.
Next Steps
After completing this notebook, you may want to:
- adapt the workflow to a different study area or ecosystem-service category
- compare alternative prompt designs or model settings
- test additional spatial layers for interpreting CES patterns
- build new interactive visualizations for communicating CES results
- explore how these methods can support your own research or management questions
Thank You
Thank you for participating in this workshop on Mapping Ecosystem Services for Decision Making. We hope this notebook provides a useful starting point for applying GeoAI and vision-language models to ecosystem-service research and practice. The methods introduced here can be extended to many real-world challenges involving people, landscapes, and decision support.
Keep exploring, keep learning, and keep mapping new ways to connect human experiences with ecosystem services.
*If you have questions about the workflow, would like to share feedback, or are interested in related research or collaboration, please explore the project resources on the FL-CES-Flows-CLIP GitHub repository. Feel free to contact Dr. Chang Zhao (changzhao@ufl.edu) and Dr. Hao-Yu Liao (haoyuliao@ufl.edu) for further inquiry.